light-dark-switchbtn

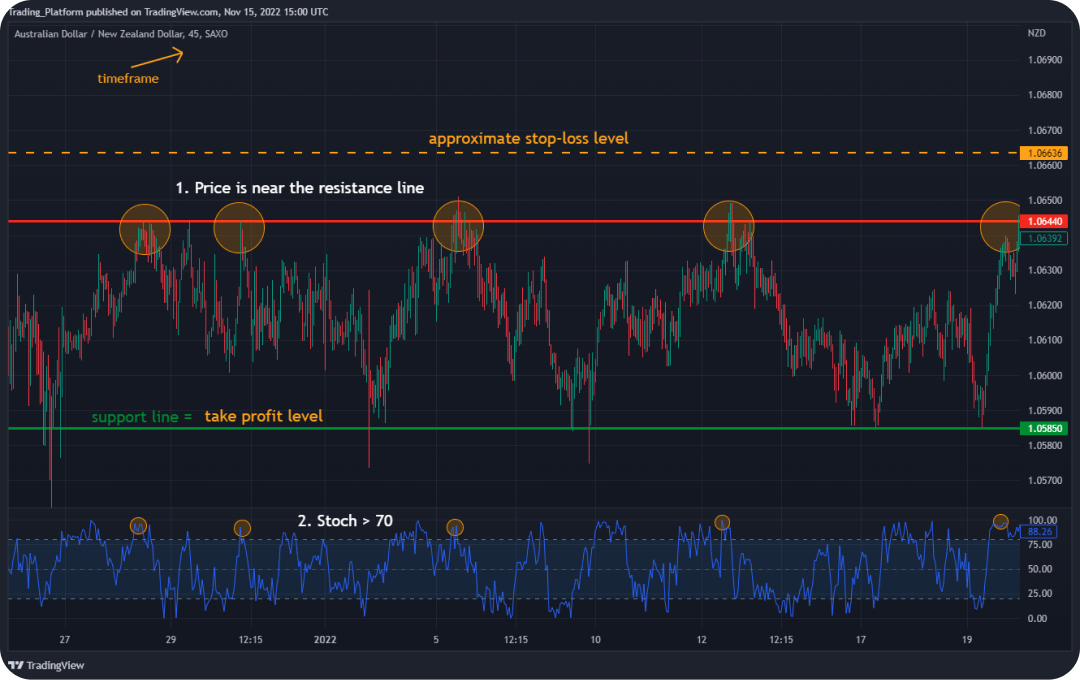
A simple stochastic-based strategy to trade in a flat market


This Trading Strategies will teach you to trade in a flat market using one of the most common indicators.

  • Timeframe: H4 chart for candlestick analysis, M15 chart for trading

  • Currency pairs:all

  • Market state:: flat

  • Required indicators:


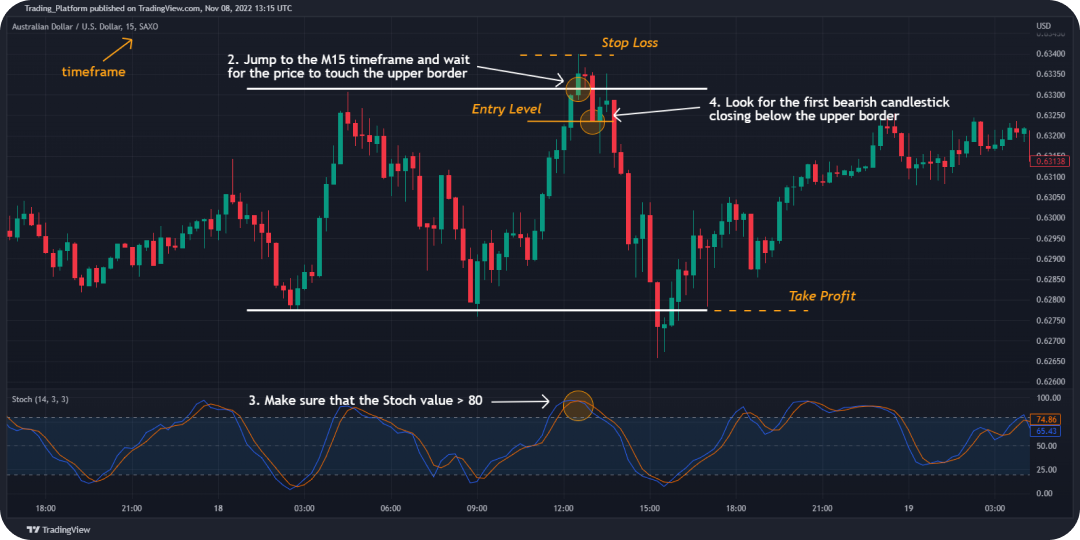
    Entry steps for a short position (Sell):
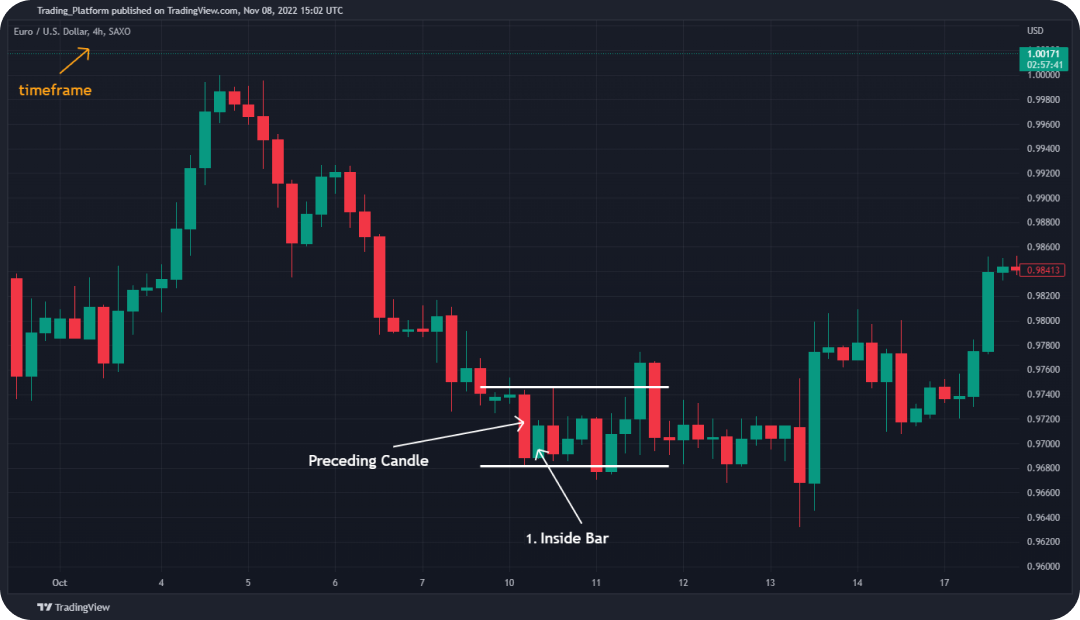
    • Look for an inside bar on a H4 timeframe and mark its borders.
    • Jump to the M15 timeframe and wait for the price to touch the upper border.
    • Make sure that the stochastic's value is greater than 80.
    • Look for the first bearish candlestick closing below the upper border.

    Stop Loss

    Place a Stop Loss above the previous swing high.


    Take Profit

    Take your profit when risk to reward ratio reaches 1:2 or when the price touches the opposite border.
Trading image 1


Alert Icon


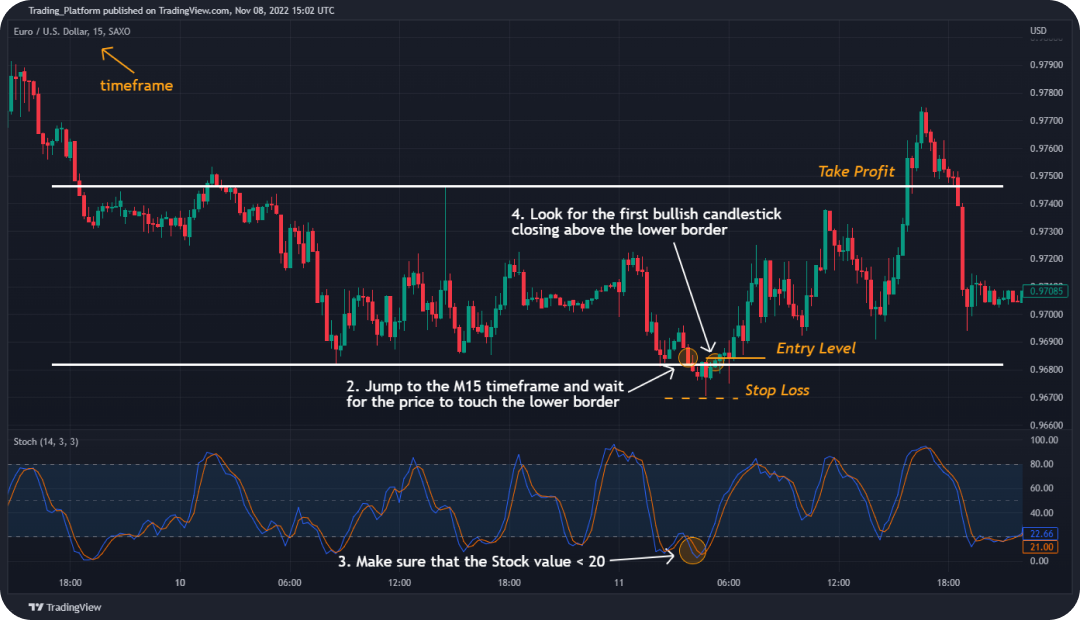
Entry steps for a long position (Buy):

  • Look for an inside bar on H4 timeframe and mark its borders..
  • Jump to the M15 timeframe and wait for the price to touch the lower border.
  • Make sure that the stochastic's value is less than 20.
  • Look for the first bullish candlestick closing above the lower border.

Stop Loss

Place a Stop Loss below the previous swing low.


Take Profit

Take your profit when the risk to reward ratio reaches 1:2 or when the price touches the opposite borderline.
Trading image 1


Trade Now
Download indicators settings to your desktop platform

If you're looking for a quick method to apply the indicators from this strategy, click on the button below. Read detailed instructions Click here.

.