This strategy will teach you to easily detect trend reversal and use it to your advantage.
Timeframe: all
Currency pairs: all
Market state: reversal
Required indicators:
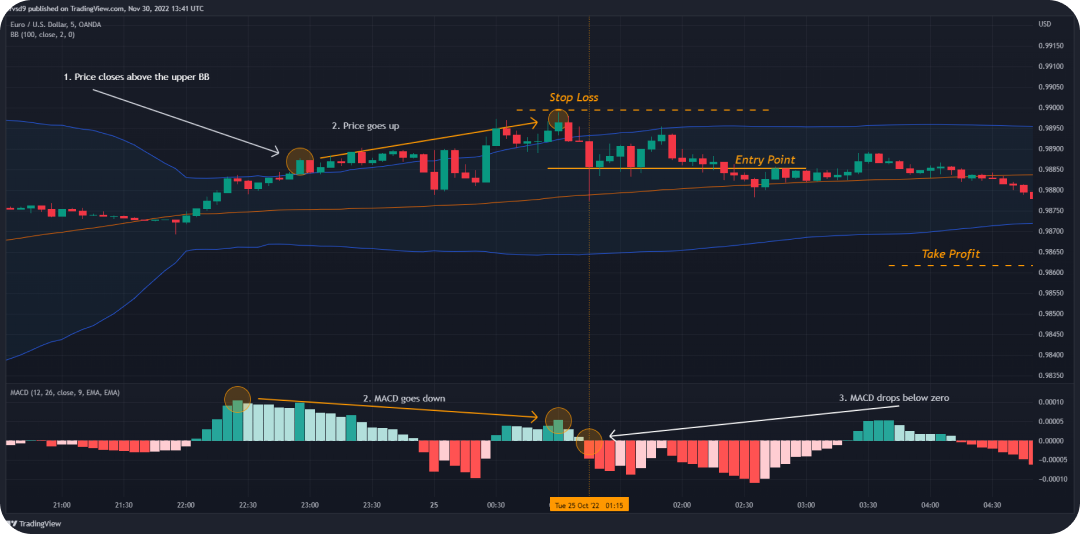
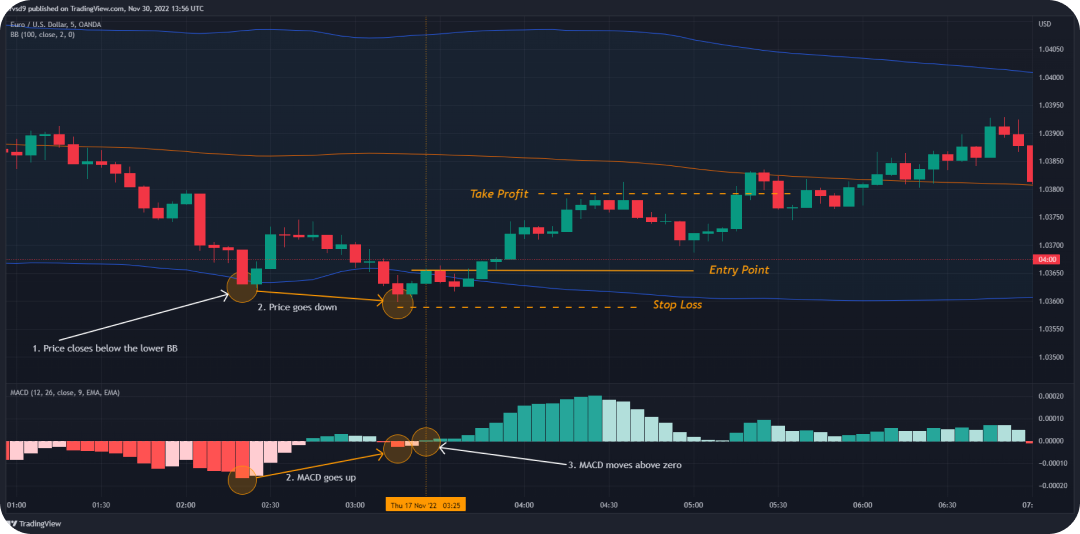
The main indicator in this strategy is MACD. It will help you detect divergence. Additionally, we will use Bollinger Band to identify 'extreme' prices that might signal the reversal of the trend. This additional filter will help you increase the accuracy of the detected signals.
To find the divergence in a Sell order, you need to draw an arrow on the histogram highs and another arrow on price highs and check if they move in different directions. For a Buy order, draw an arrow on histogram lows and another on price lows and check if they move in different directions.
Set the Stop Loss order above the previous high and before the entry point.
Take ProfitTake your profit with a risk-reward ratio of 1:1.5.

Set the Stop Loss order above the previous high and before the entry point.
Take ProfitTake your profit with a risk-reward ratio of 1:1.5.

If you're looking for a quick method to apply the indicators from this strategy, click on the button below. Read detailed instructions Click here.