The Ichimoku Cloud, also known as Ichimoku Kinko Hyo, is a versatile technical analysis indicator that provides an integral view of the market Use the Ichimoku Cloud trading strategy to find trends, support and resistance levels, and potential reversal points.
What is the Ichimoku indicator, and how it works
Five main components of the Ichimoku Cloud
How to add the Ichimoku indicator to a price chart
Setting up Ichimoku Kinko Hyo in PemaxxTrader
Installing the indicator in MetaTrader 5
How to use the Ichimoku strategy for trading
Using Ichimoku Kinko Hyo to identify trends
Using the Ichimoku Cloud to confirm trends
Using the Kumo Twist to get trading signals
Ichimoku buy signals: best entry points for a long position
Ichimoku sell signals: best entry points for a short position
Suitable timeframes: all (up to H6 for scalping)
Trading instruments:currency pairs, stocks, indices, commodities, cryptocurrencies
Best currency pairs:all (most often used for JPY pairs like USDJPY)
Required indicators: Ichimoku Kinko Hyo
Trading platforms: pemaxxTrader, MetaTrader 5
The Ichimoku Cloud indicator was developed by Goichi Hosoda, a Japanese journalist, in the late 1930s. He then spent about 30 years perfecting the trading strategy before making it public in the late 1960s. Its original name, Ichimoku Kinko Hyo, translates from Japanese as ‘equilibrium chart at a glance’, highlighting its ability to provide a quick and informative view of market conditions.
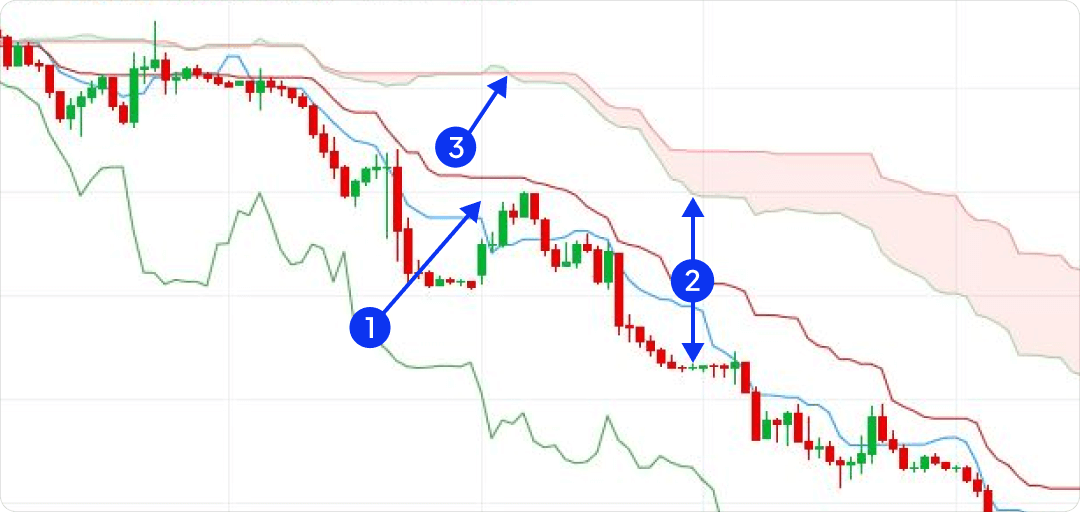
The Ichimoku Kinko Hyo technical indicator is a collection of five different lines.
Various trading strategies use different combinations of these lines to analyse trends and spot potential reversal points. To learn more about their practical use, skip to our examples on how to use the indicator for trading.
The area between Lead 1 and Lead 2 is called the Cloud (Kumo). It is an essential part of the indicator that might provide valuable insights into support or resistance levels. The area is coloured differently depending on the trend direction. To learn more about how you can use the Cloud to find good trading opportunities, skip to our illustrated examples.
To install the indicator, open PemaxxTrader and press the Indicators button above the chart window.
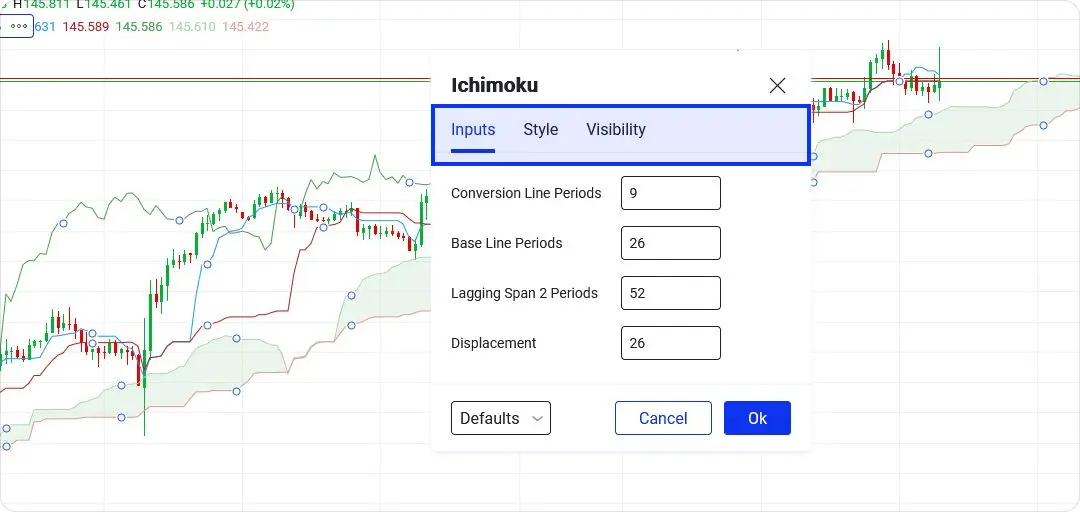
Installing the Ichimoku in MT5 is also simple. Open a chart, then go to the Insert tab of the main menu. Press Indicators > Trend > Ichimoku Kinko Hyo. Customise your indicator or press OK to apply the default settings.
To start using Ichimoku Kinko Hyo for trading, sign up and create a free Pemaxx trading account in just a few easy steps. All you need is a valid email address or a social media account.
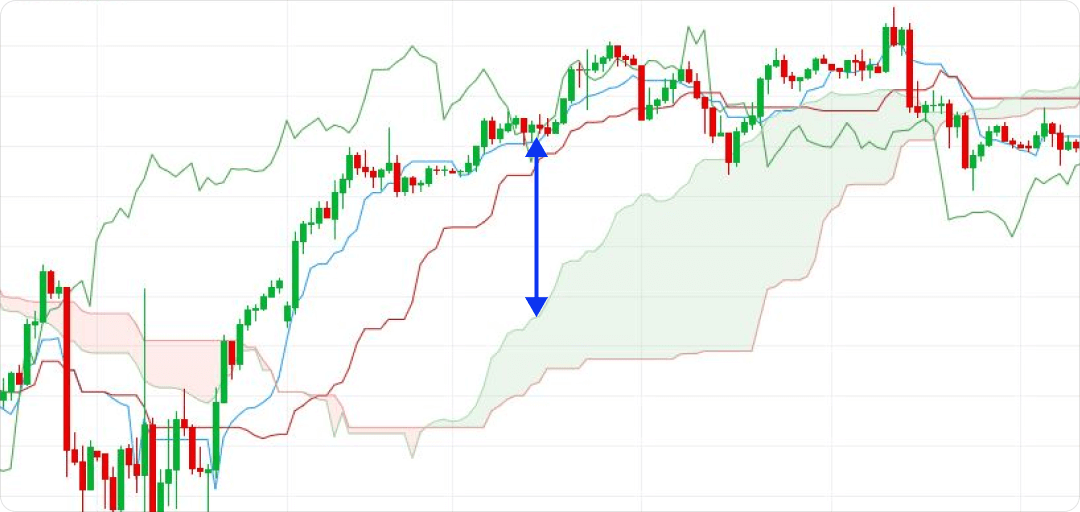
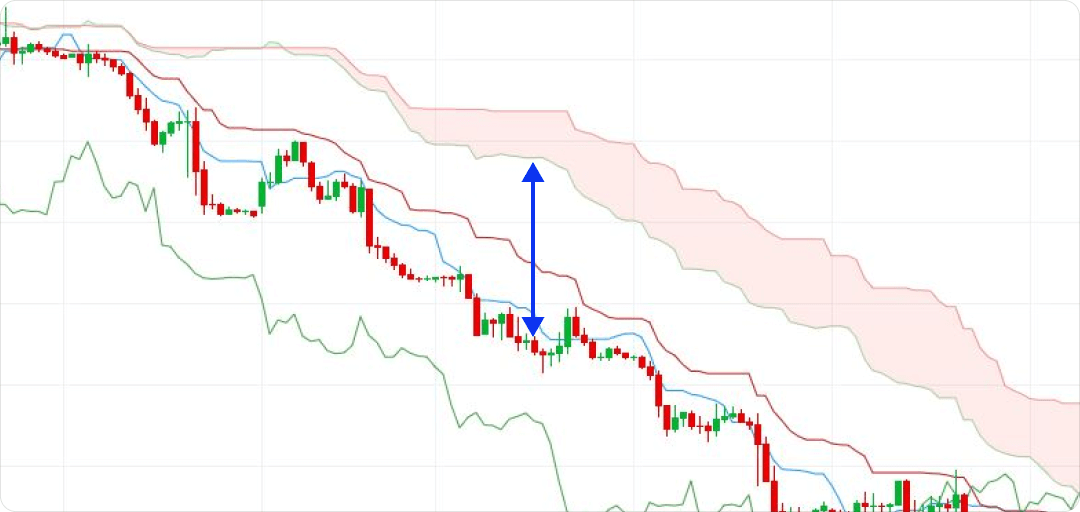
One of the primary applications of the Ichimoku trading system is identifying the overall trend of an asset. Before entering a trade, check out how the price chart and the Cloud are positioned relative to one another.
If the price is above the Cloud, it supports a long (buy) opportunity.
If the price is below the Cloud, it supports a short (sell) opportunity.
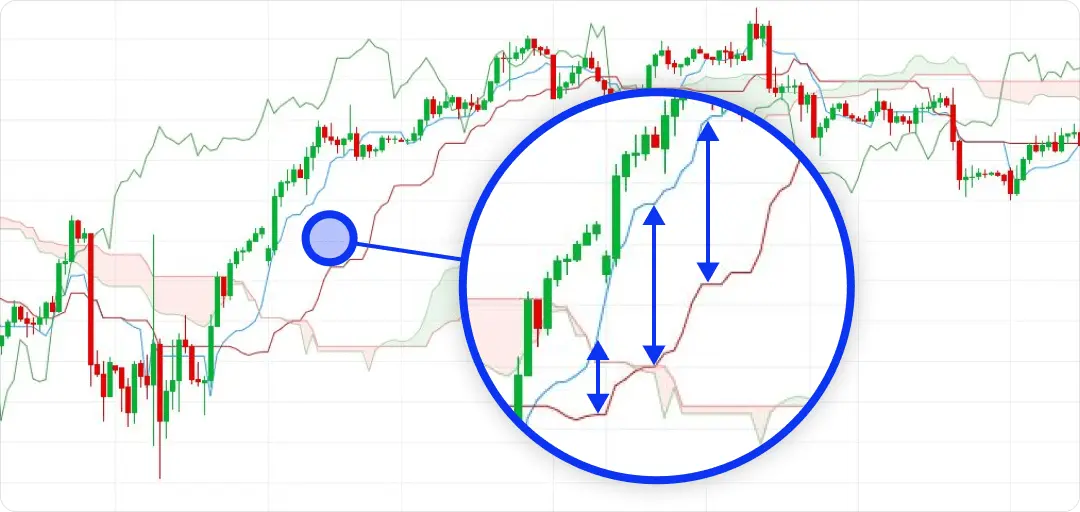
Look for crossovers of the Conversion Line and the Base Line to confirm strong trends and find out which way the market is currently heading.
If the Conversion Line consistently remains above the Base Line, it indicates a bullish trend.
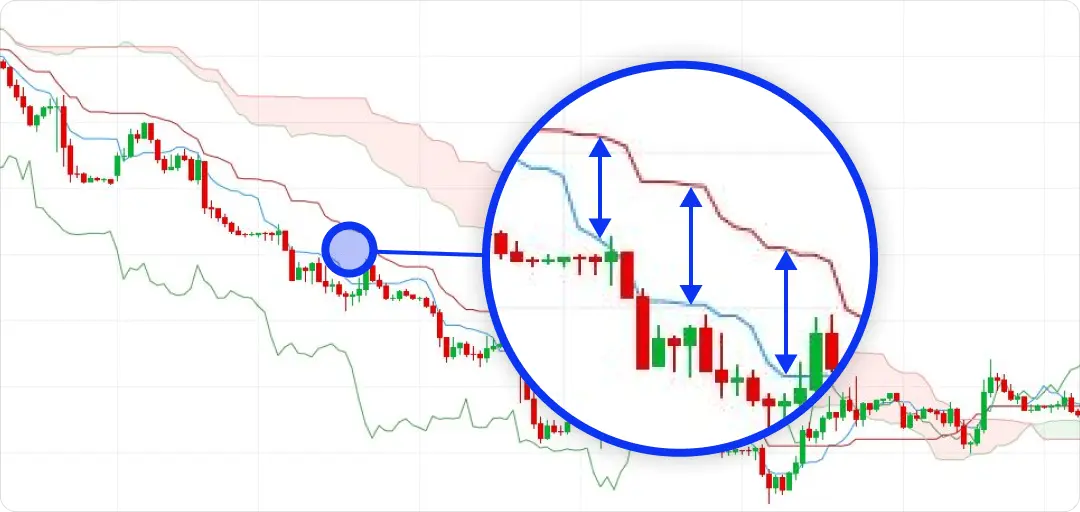
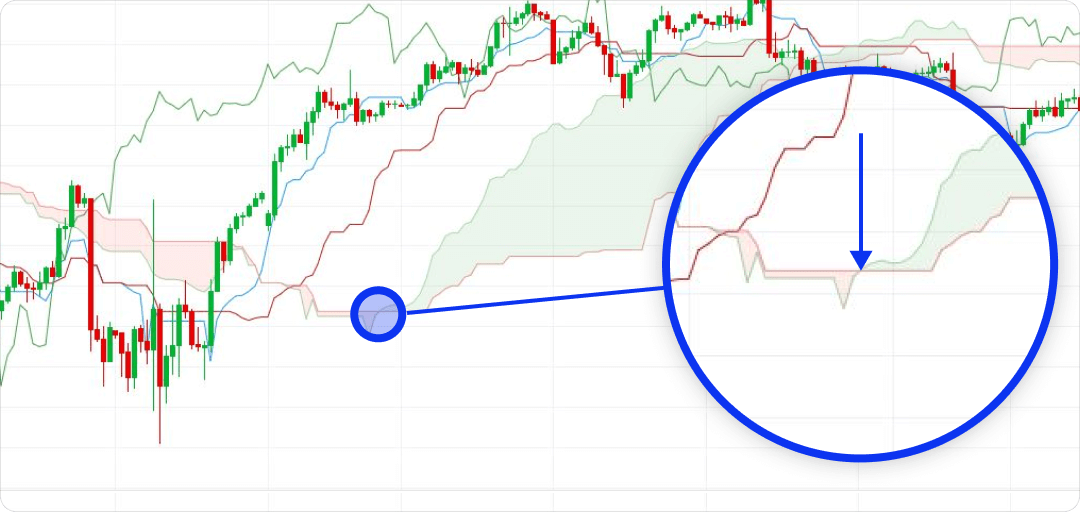
Another critical aspect of the Ichimoku strategy is the Kumo Twist, when Lead 1 and Lead 2 meet.
When Lead 1 crosses above Lead 2, it suggests a bullish crossover: the trend is probably heading upwards.
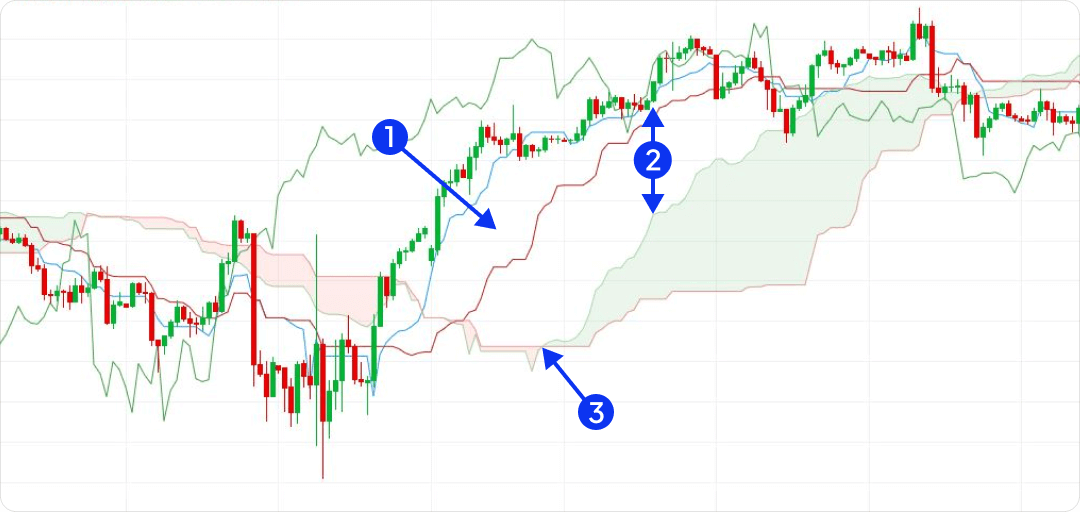
An additional confirmation for a possible bullish trend is an Ichimoku Bullish Kumo Breakout. If the price consolidates within the Cloud and then breaks above the upper Cloud boundary, it can be a sign of a potential bullish breakout. This breakout can be considered an entry point to buy.
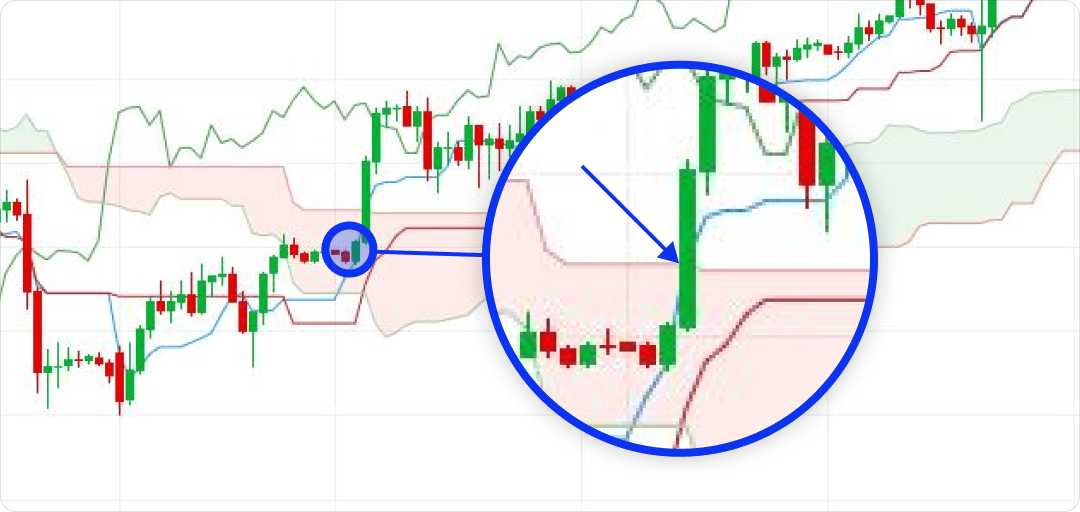
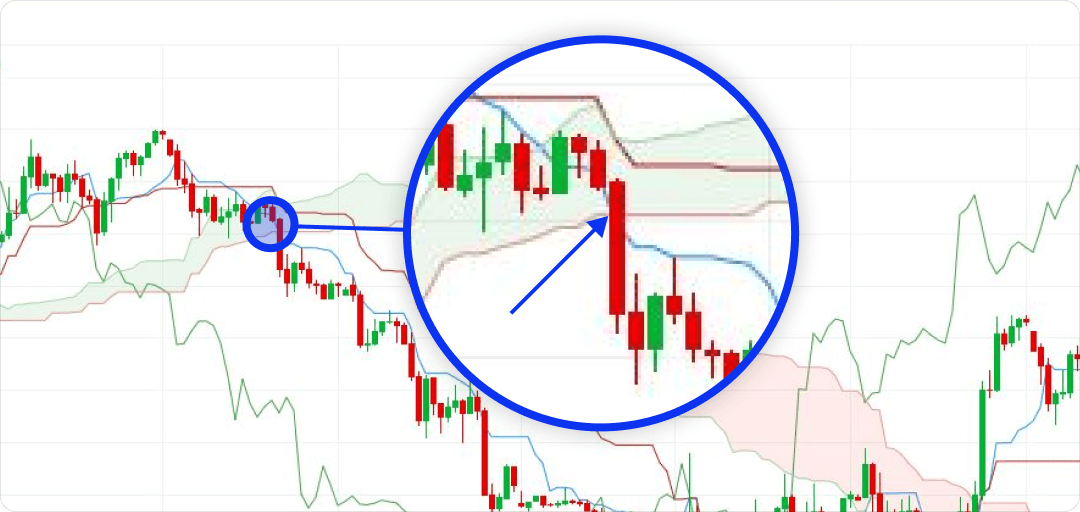
An additional confirmation for a possible bearish trend is an Ichimoku Bearish Kumo Breakout. If the price consolidates within the Cloud and then breaks below the lower Cloud boundary, it can be a sign of a potential bearish breakout. This breakout can be considered an entry point to sell.
If you're looking for a quick method to apply the indicators from this strategy, click on the button below. Read detailed instructions Click here.