In technical analysis, a flag is a chart pattern you can use to predict trend continuation. This article will teach you how to detect a flag on the price chart and which trading strategy you should apply.

Get fresh market news, expert insights, and bite-sized educational materials in Space, your personalised feed available for free on all PeMaxxTrader accounts. Apply the insights to trade in one touch with necessary technical analysis tools included.
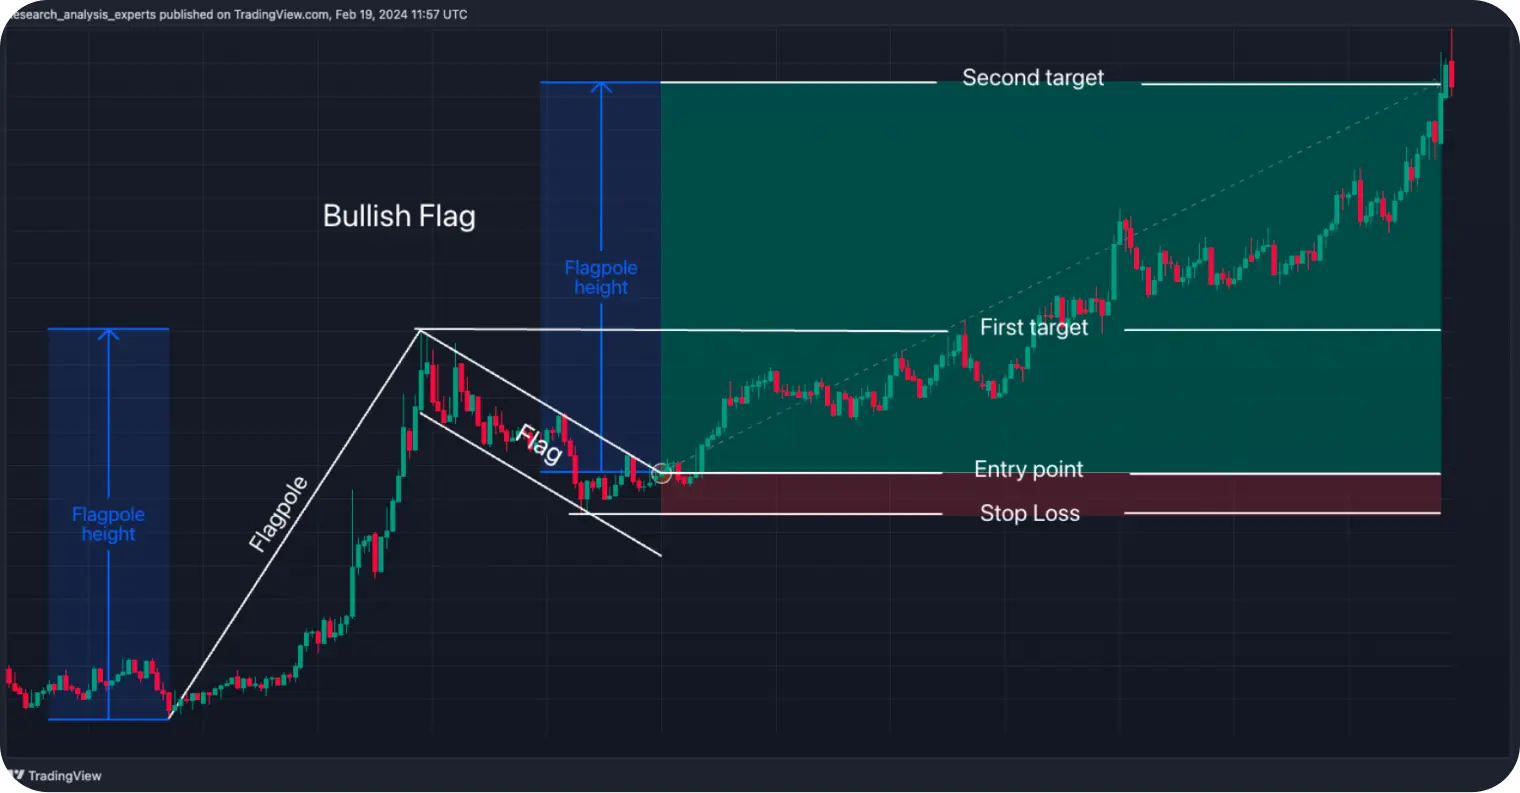
Try PeMaxxTraderA flag usually forms during a strong market trend. This pattern consists of a sharp price movement (or the flagpole) and a short-range-bound movement against the trend (or the flag itself) following it. That's why a flag is also called the flag and pole pattern.
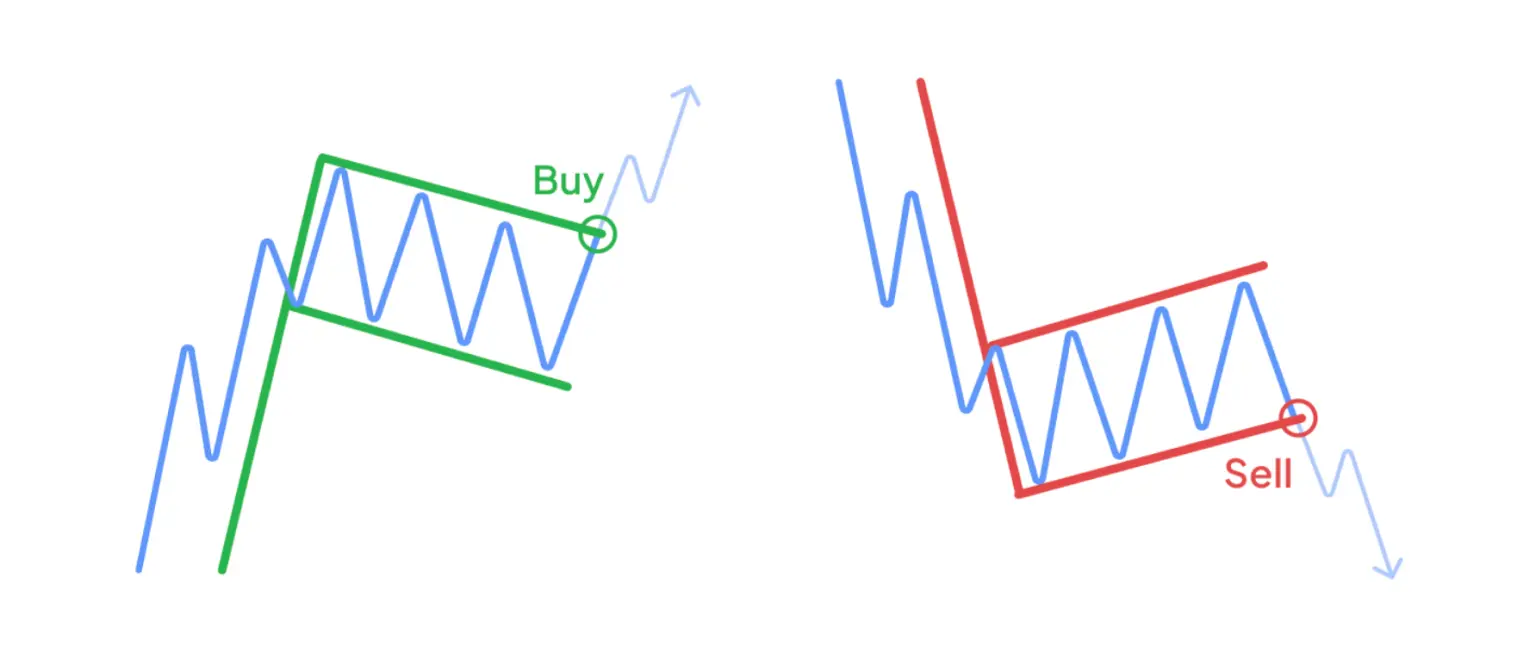
Flags can form on both upward and downward trends. If a flag forms on an upward (bullish) trend, it gets called the bullish flag pattern. If it forms on a downward (bearish) trend, it's called the bearish flag pattern or the inverted flag pattern.
A valid flag indicates that the general trend will probably continue in the same direction. When a bullish flag forms, the trend may continue going up afterwards. If a bearish flag appears, the trend will probably resume its downward movement soon.
The flag and pole chart pattern is one of the most reliable continuation patterns. It works on all timeframes and for any instrument, including Forex pairs, stocks, and crypto. However, you must learn to identify and confirm it to avoid mistakes and unnecessary losses.
To find a bull flag pattern, wait for a sharp price surge. When it turns into a slight downward consolidation, look for the flag's body fitting between two parallel lines. Once the price breaks out from the upper line, it will probably continue going up, completing the pattern.
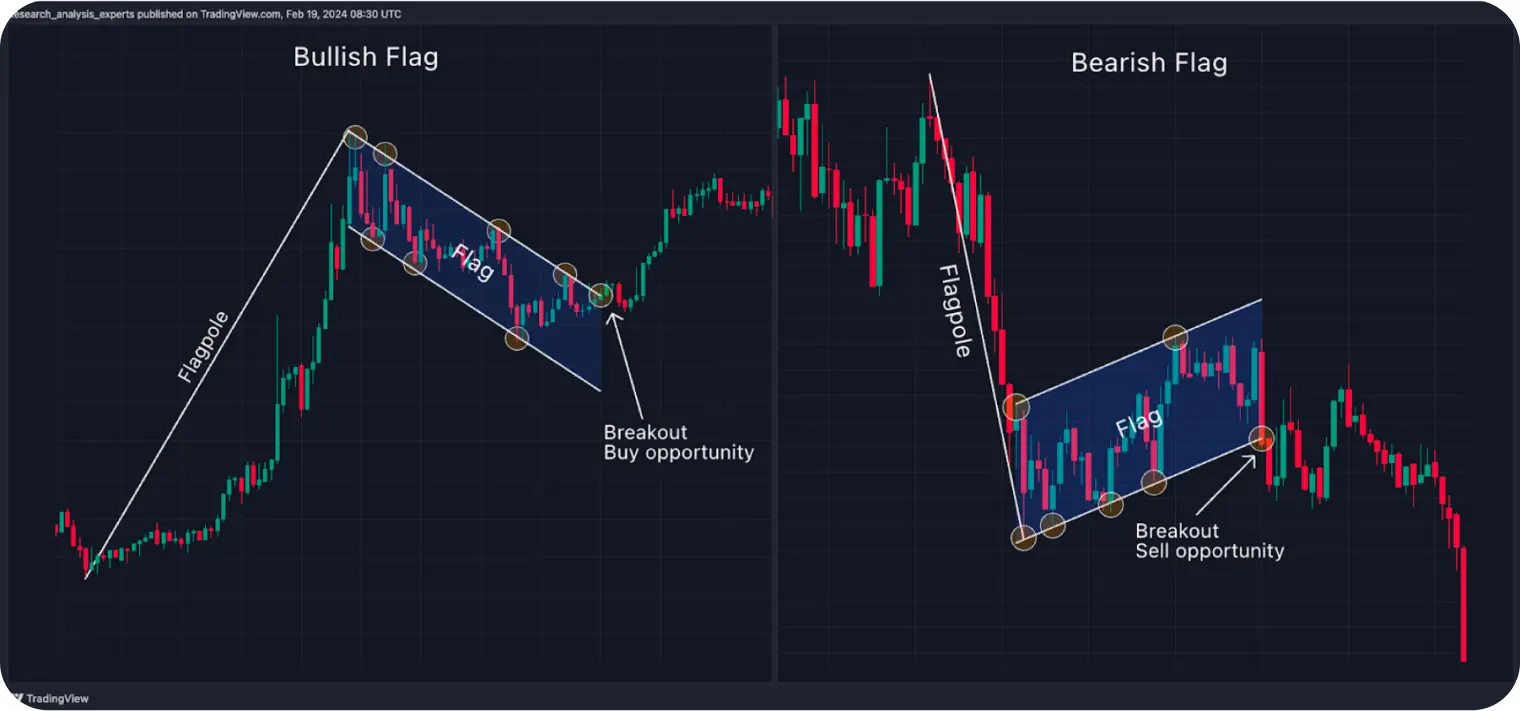
To find a bearish flag and pole pattern, locate a sharp price decline. Look for a slight upward consolidation when the price increases between two parallel lines. Once the price breaks out from the lower line, it will probably continue going down, completing the reverse flag pattern.
A valid flag usually lasts five to twenty price bars, and its body must be smaller than the pole.
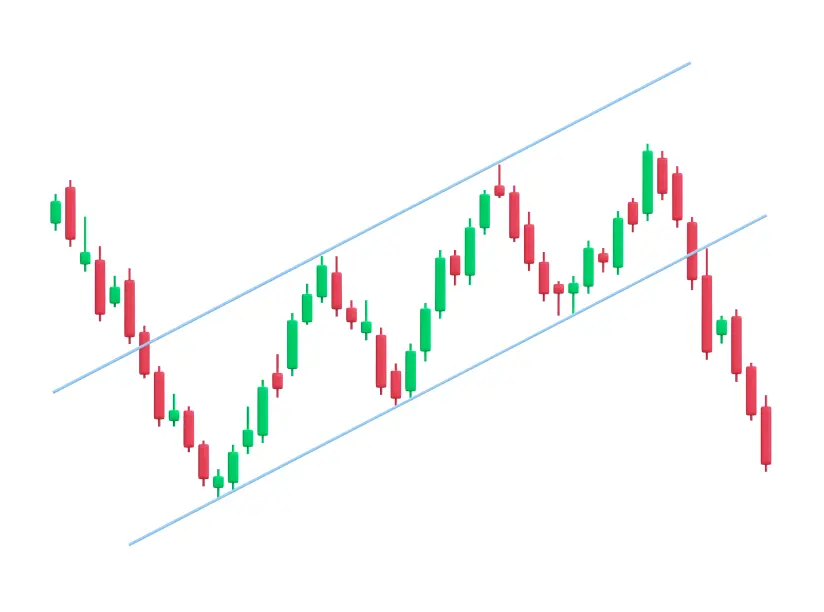
Make sure the lines constraining the flag pattern are roughly parallel. If they visibly
converge, it is another chart figure called the wedge pattern. A wedge can signify a
possible trend reversal if its trend lines are aligned with the current trend's direction.

You can confirm an upcoming flag pattern breakout by looking at volume patterns. The volume tends to increase during the initial movement and then slightly decline. Wait for a sudden increase in volume at the possible breakout point to confirm the trend continuation.
A correctly identified rising flag pattern indicates an upward trend, so prepare to buy the asset.
1.After the pattern forms, wait for a breakout indicating the bullish trend.
2.Enter the trade immediately or wait for the price to retest the breakout level from above.
3.Place a Buy order and set your Stop Loss below the minimal price level within the flag. To define how much you should invest, ensure the Stop Loss is less than 5% of your total deposit.
4.Set your first Take Profit at the local maximum. The next bullish flag pattern target can be set at the height of the flagpole.
The psychology behind the ascending triangle pattern is that some buyers
patiently wait for the breakout, placing higher bids. Once the pattern gets
confirmed, more buyers rush in, pushing the price up.
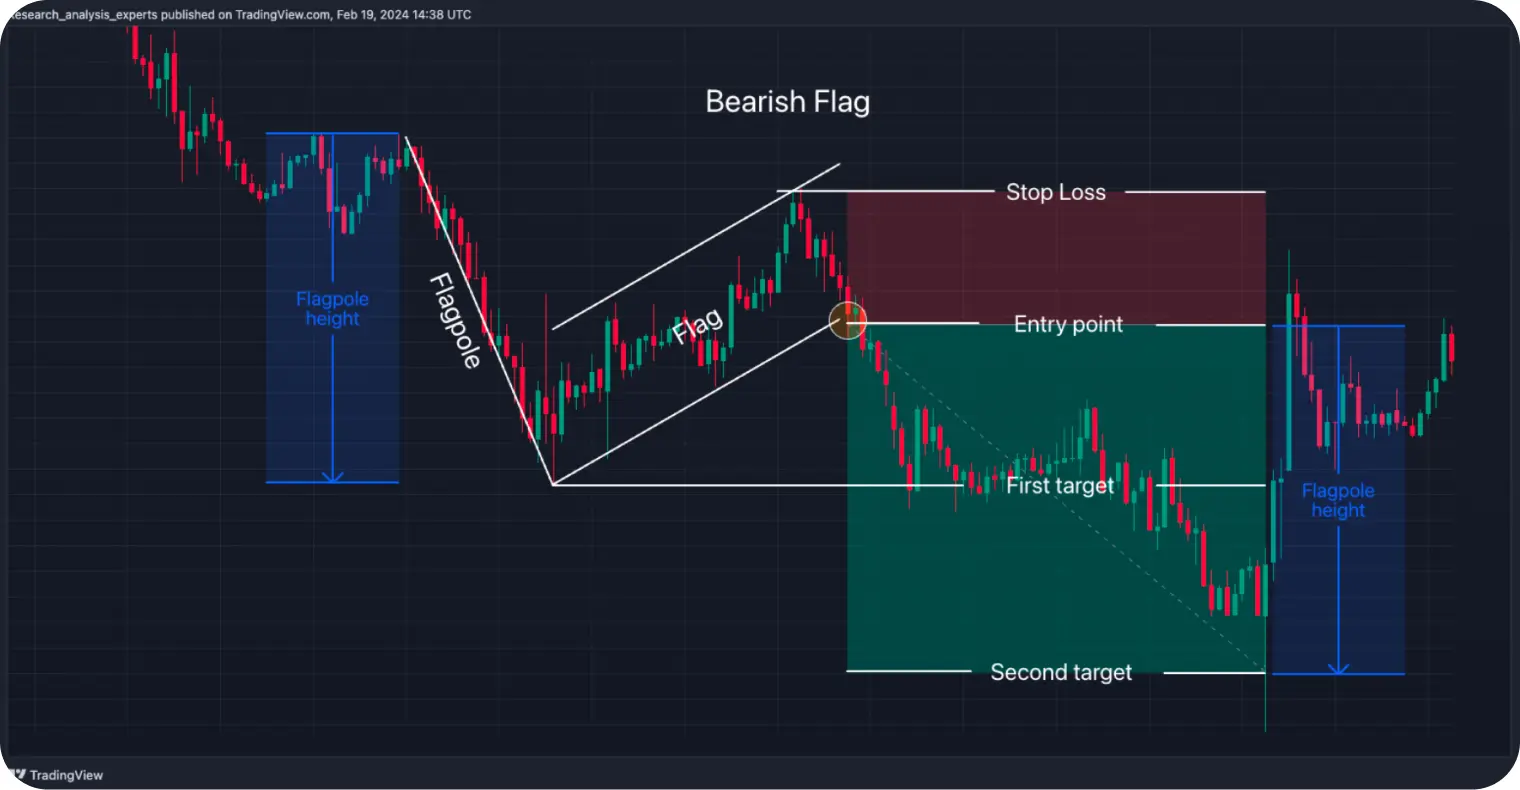
Seeing a flag pattern upside down means you should expect the downward trend to continue.
1.Once the pattern forms, wait for a breakout indicating the bearish trend.
2.Enter the trade immediately or wait for the price to retest the breakout level from below. click here
3.Place a Sell order and set your Stop Loss above the highest price level within the flag. To define how much you should invest, ensure the Stop Loss is less than 5% of your total deposit.
4.Set your first Take Profit at the local minimum. The next target for the inverted flag pattern should match the length of the flagpole.
