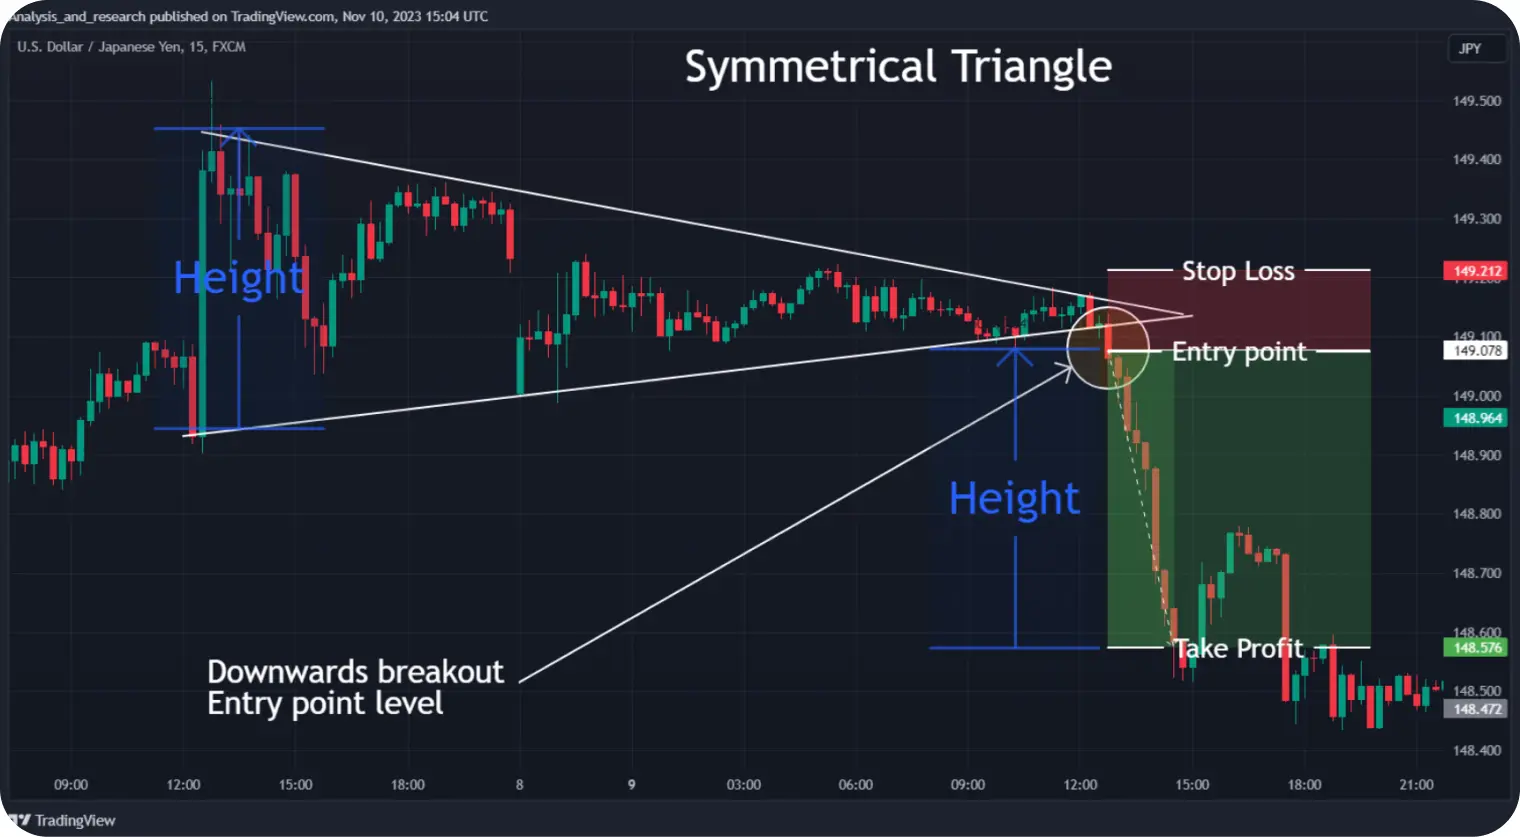
Triangle is a widely recognised chart pattern defined by two converging trend lines. This article will teach you how to spot different types of triangles and which trading strategy to apply for each of them after the breakout.

Get fresh market news, expert insights, and bite-sized educational materials in Space, your personalised feed available for free on all PeMaxxTrader accounts. Apply the insights to trade in one touch with necessary technical analysis tools included.
Try PeMaxxTraderThe triangle chart pattern is formed by two converging trend lines drawn along a narrowing price range. There are three types of triangles: ascending, descending, and symmetrical.
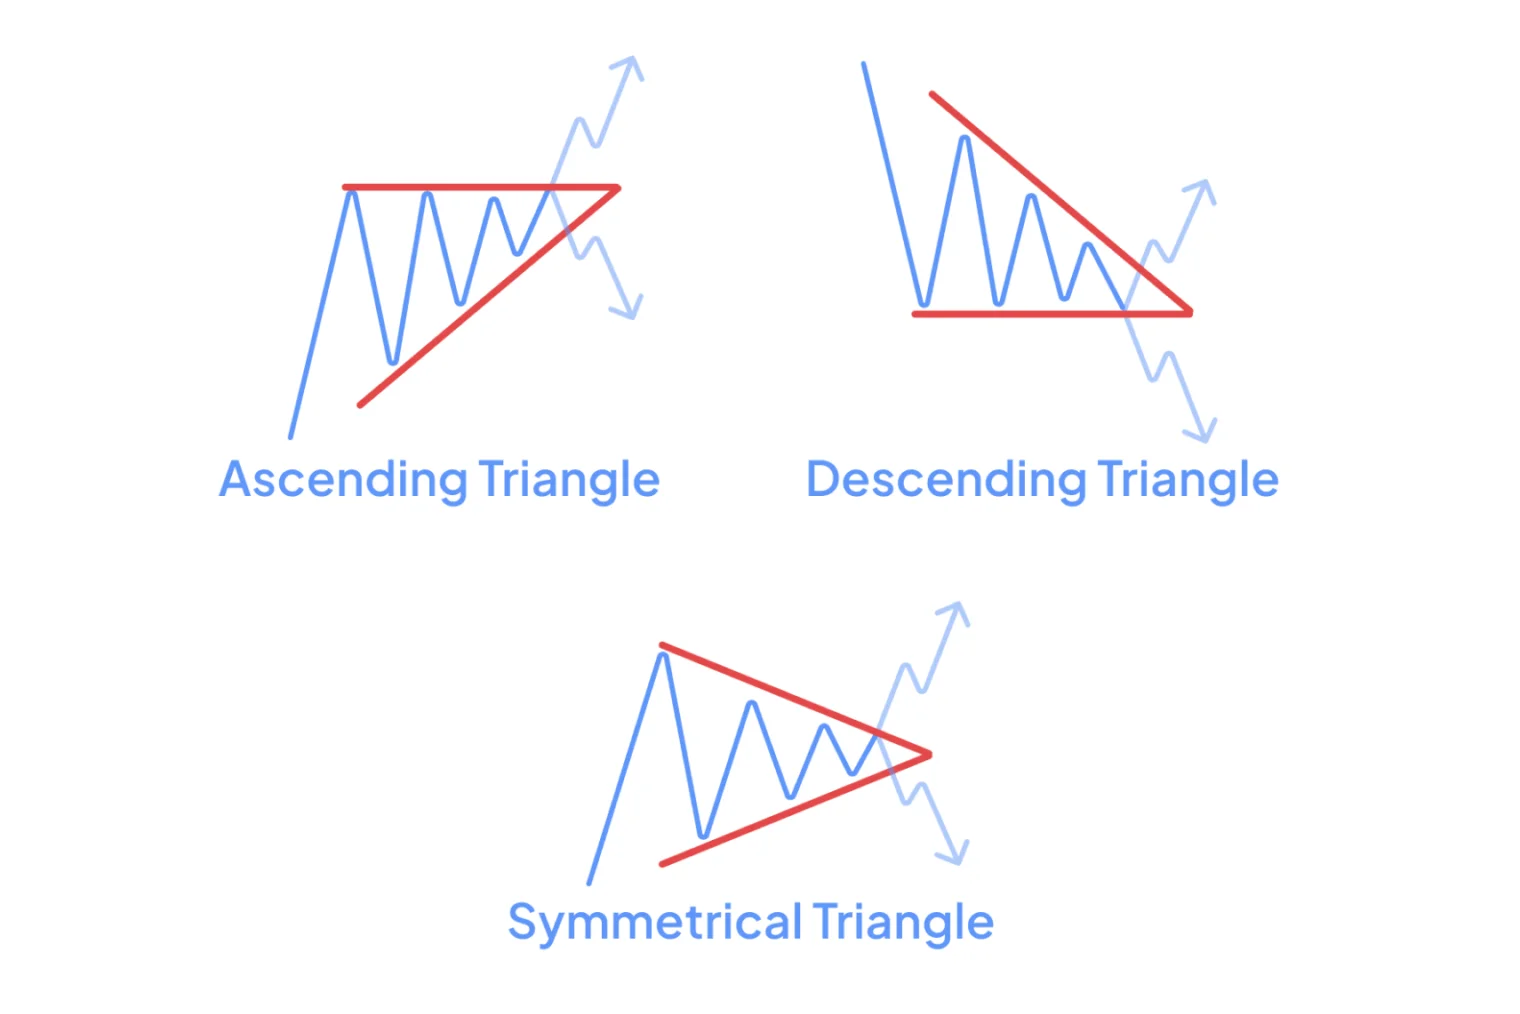
You can easily tell different types of triangles apart by looking at the slope of the trend lines:
horizontal upper line, diagonal lower line—ascending triangle pattern
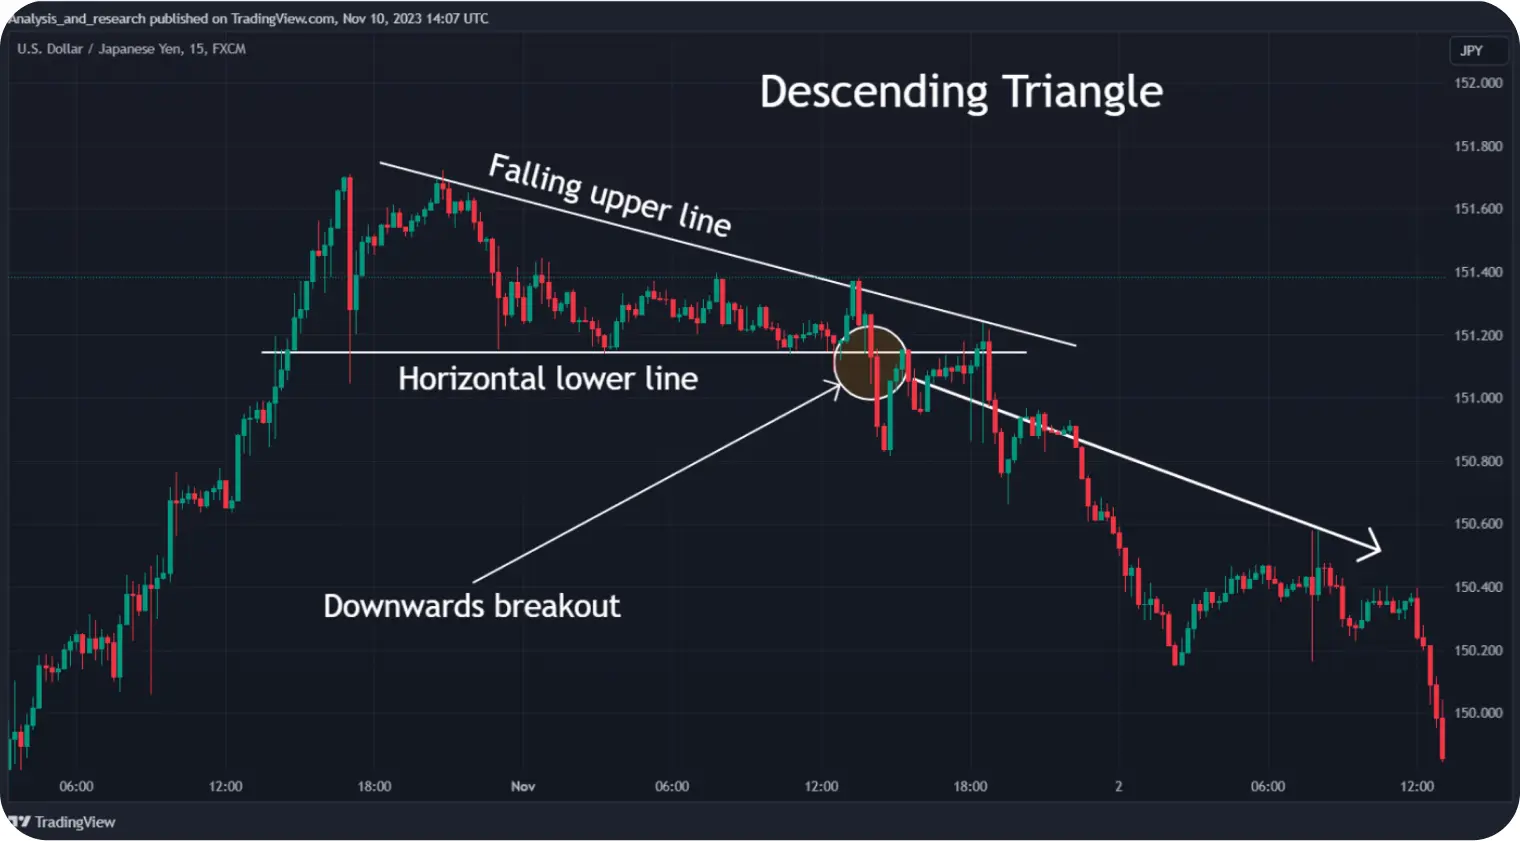
diagonal upper line, horizontal lower line—descending triangle pattern
both upper and lower lines are diagonal—symmetrical triangle pattern.
To choose an effective trading strategy , you must first define the type of a triangle correctly.

Triangle is not to be confused with the expanding triangle pattern. Two converging lines form triangles, wherea an expanding triangle is constrained by two diverging line resembling a megaphone. The latter can be difficult to exploit, especially for novice traders, and require a special approach.
A valid triangle indicates an opposition between buyers and sellers. It means traders are unsure of which way the market is going to move.Triangles often appear before the release of important news.
The triangle pattern is considered a continuation pattern. However, false triangle signifies a strong trend reversal. That means you should be very careful when trying to identify and confirm this pattern.
Triangles occur on all timeframes for any asset,including Forex pairs, stocks, and cryptocurrencies. They can appear in any market context regardless of the preceding trend direction.

A valid triangle usually includes at least five touches of support and resistance. Look for a consolidation on the chart and then wait for several touches to confirm it.
An ascending triangle forms when a narrowing trading range repeatedly touches a certain resistance leve and then breaches it. A strong upward trend follows the breakout, finishing this bullish pattern.
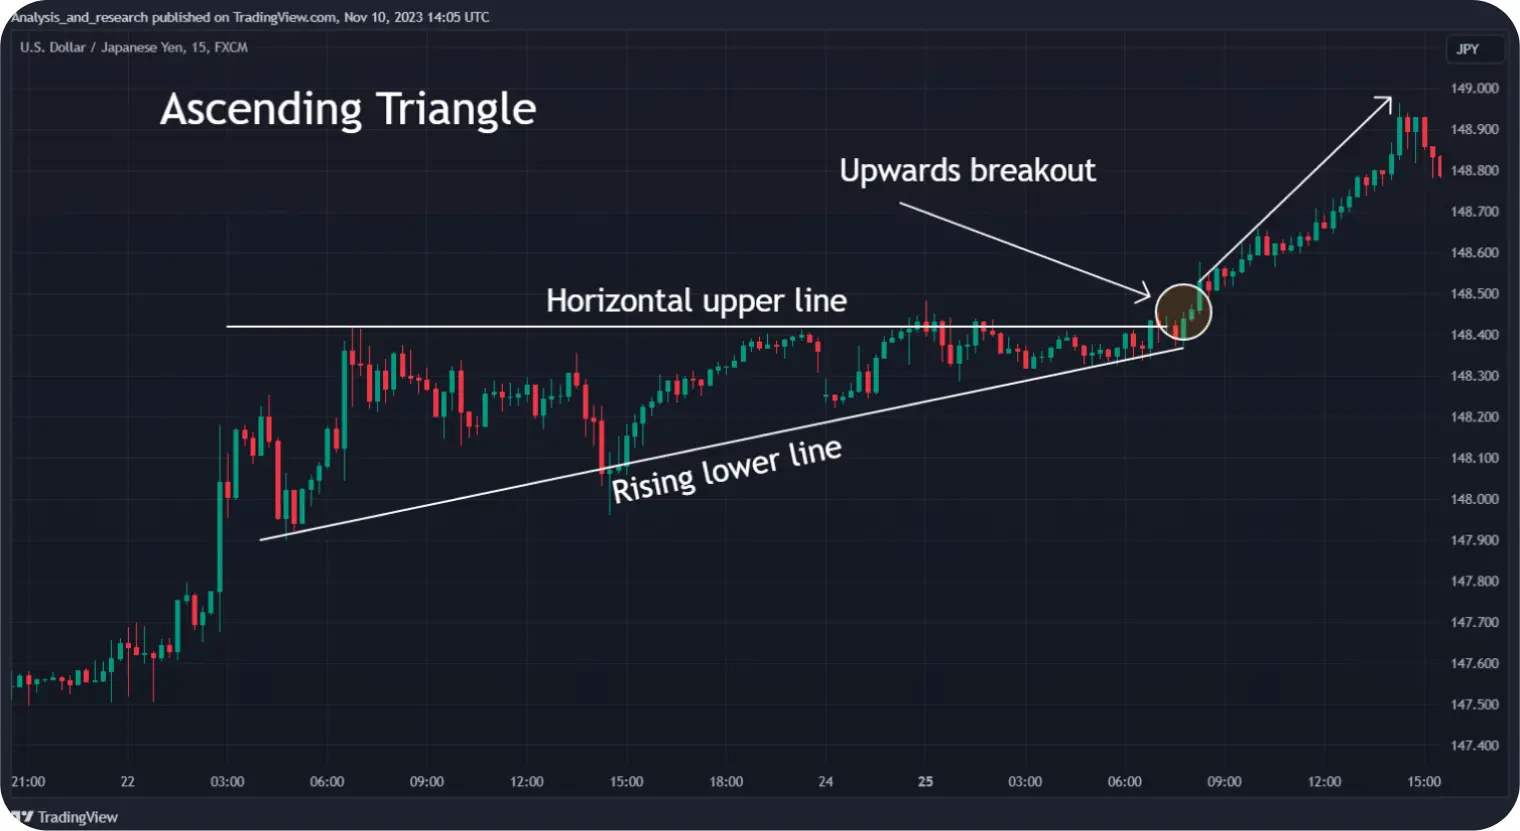
The psychology behind the ascending triangle pattern is that some buyers patiently wait for the breakout, placing higher bids. Once the pattern gets confirmed, more buyers rush in, pushing the price up.
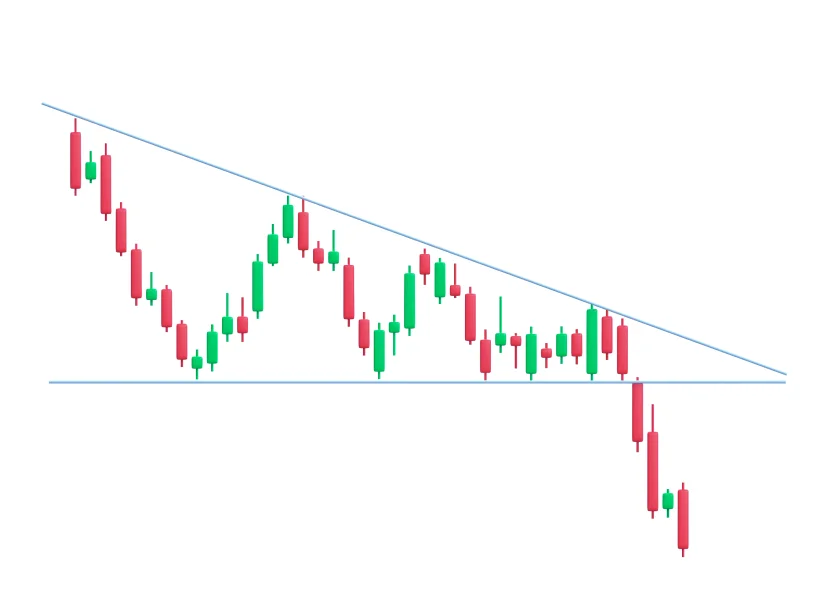
A descending triangle is the opposite of the ascending type. The price repeatedly touches a support level before collapsing through it. A strong downward trend follows, finishing this bearish pattern.
A symmetrical triangle has two diagonal trend lines with no clear support or resistance levels. It can break in any direction, so it can turn out to be a bullish or bearish pattern depending on the outcome.
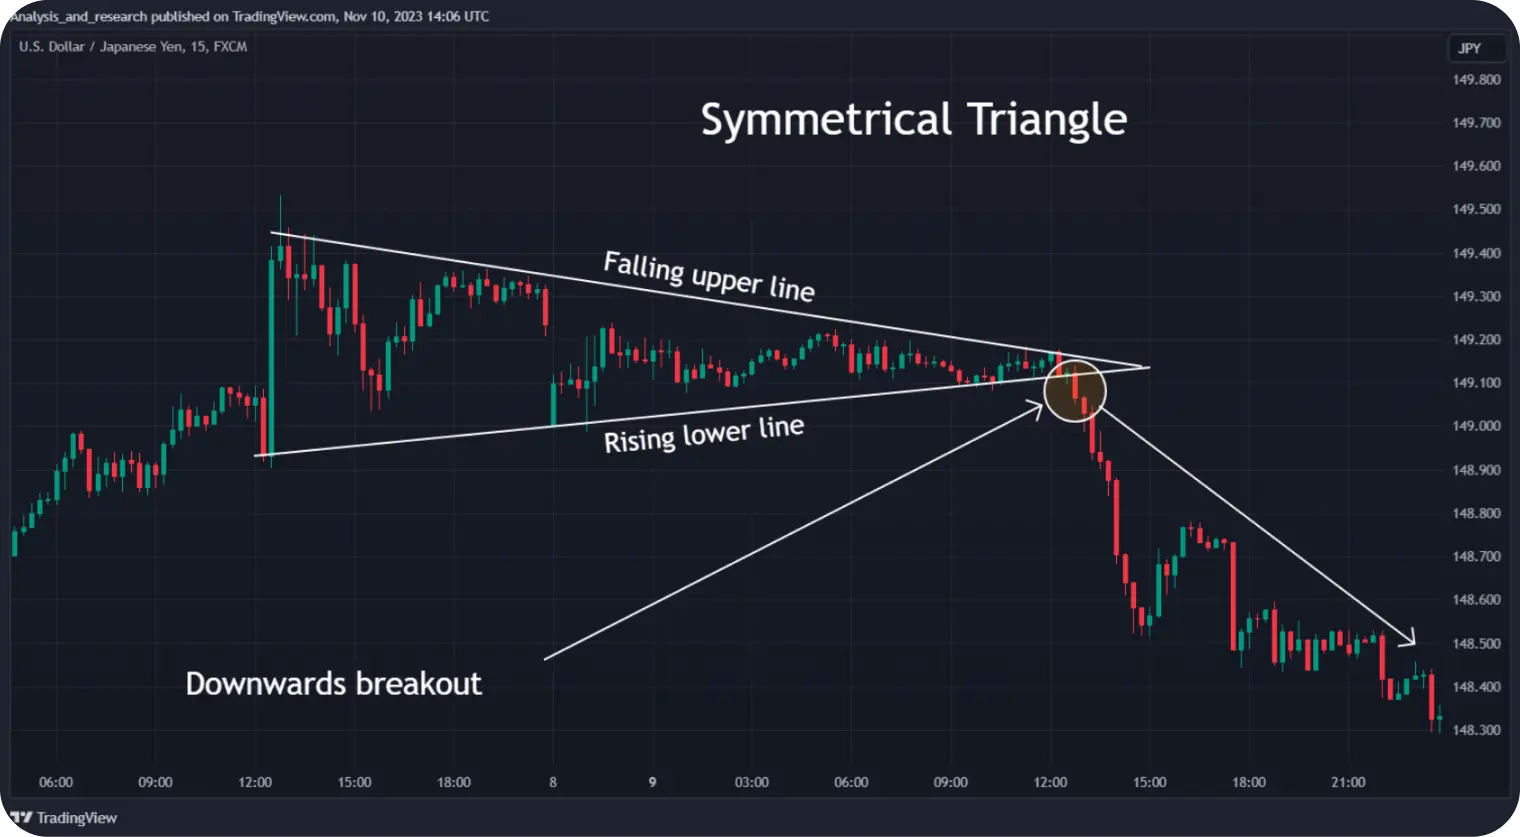
The symmetrical triangle is the most frequent type of the triangle pattern. When neither buyers nor sellers can push the price in their direction, any sharp movement will start a new strong trend.
To successfully exploit a pattern, you must correctly identify it and then wait for the breakout. Once it gets clear which way the price is moving next, enter the market using the appropriate strategy click here..

While some outcomes are more probable than others, the breakout can occur in both directions, so it is important to confirm any type of the triangle pattern. To be sure, look for a spike in trading volume and skip a couple of candlesticks or wait for a retest to confirm the forming trend.
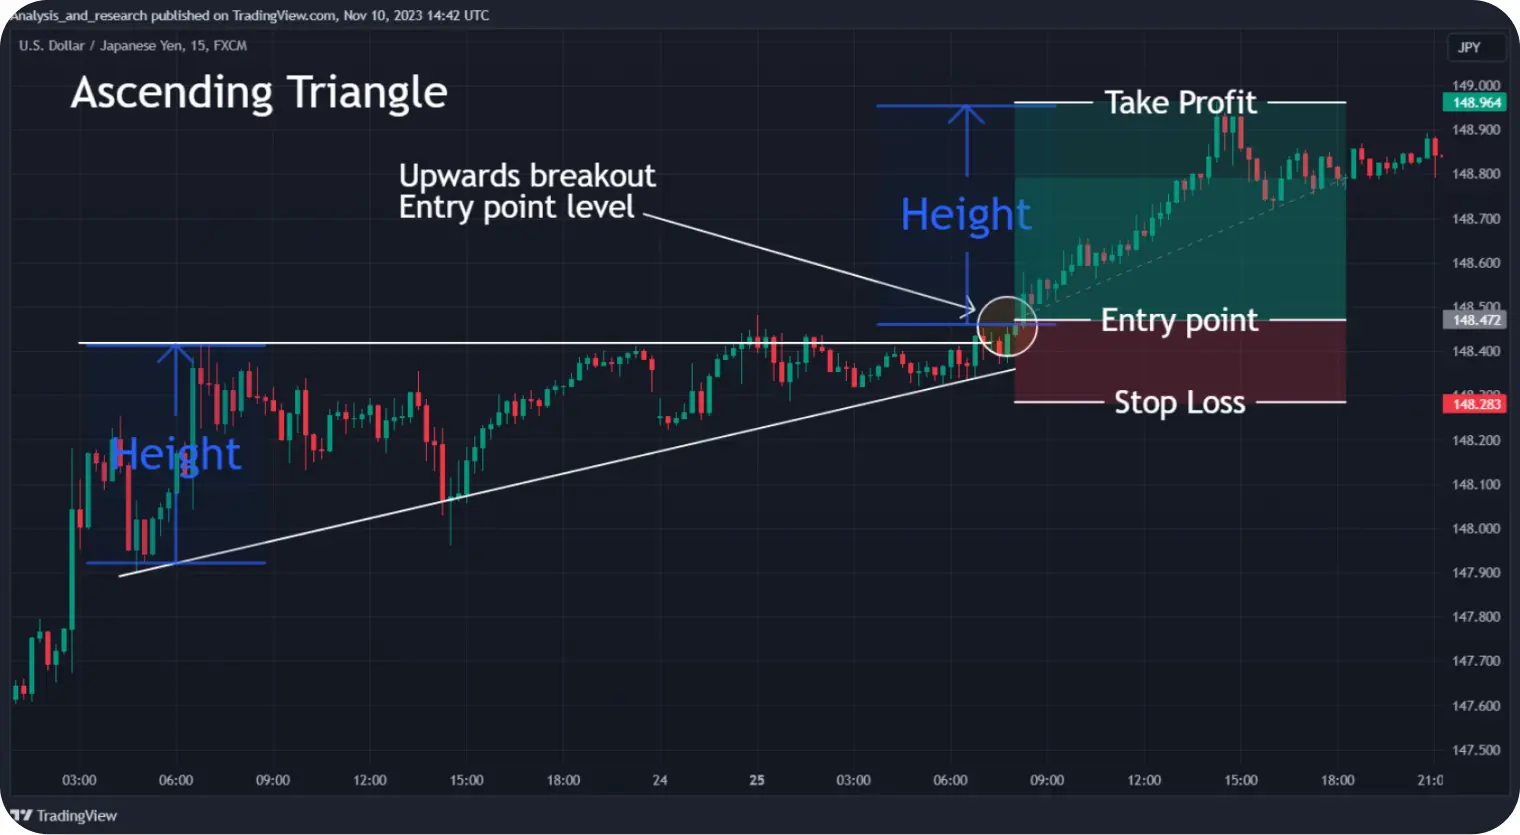
A valid ascending triangle probably indicates an upward trend, so prepare to buy the asset.
1.After the pattern forms, wait for a breakout indicating the bullish trend.
2.If the price breaks out downwards, place a Sell order with a Stop Loss above the last maximum.
3.If the price breaks out upwards (as expected), place a Buy order with a Stop Loss below the last minimum. You can also wait for additional confirmation, such as a retest from above, to be sure.
4.Set your Take Profit above the triangle at the level equal to its height.
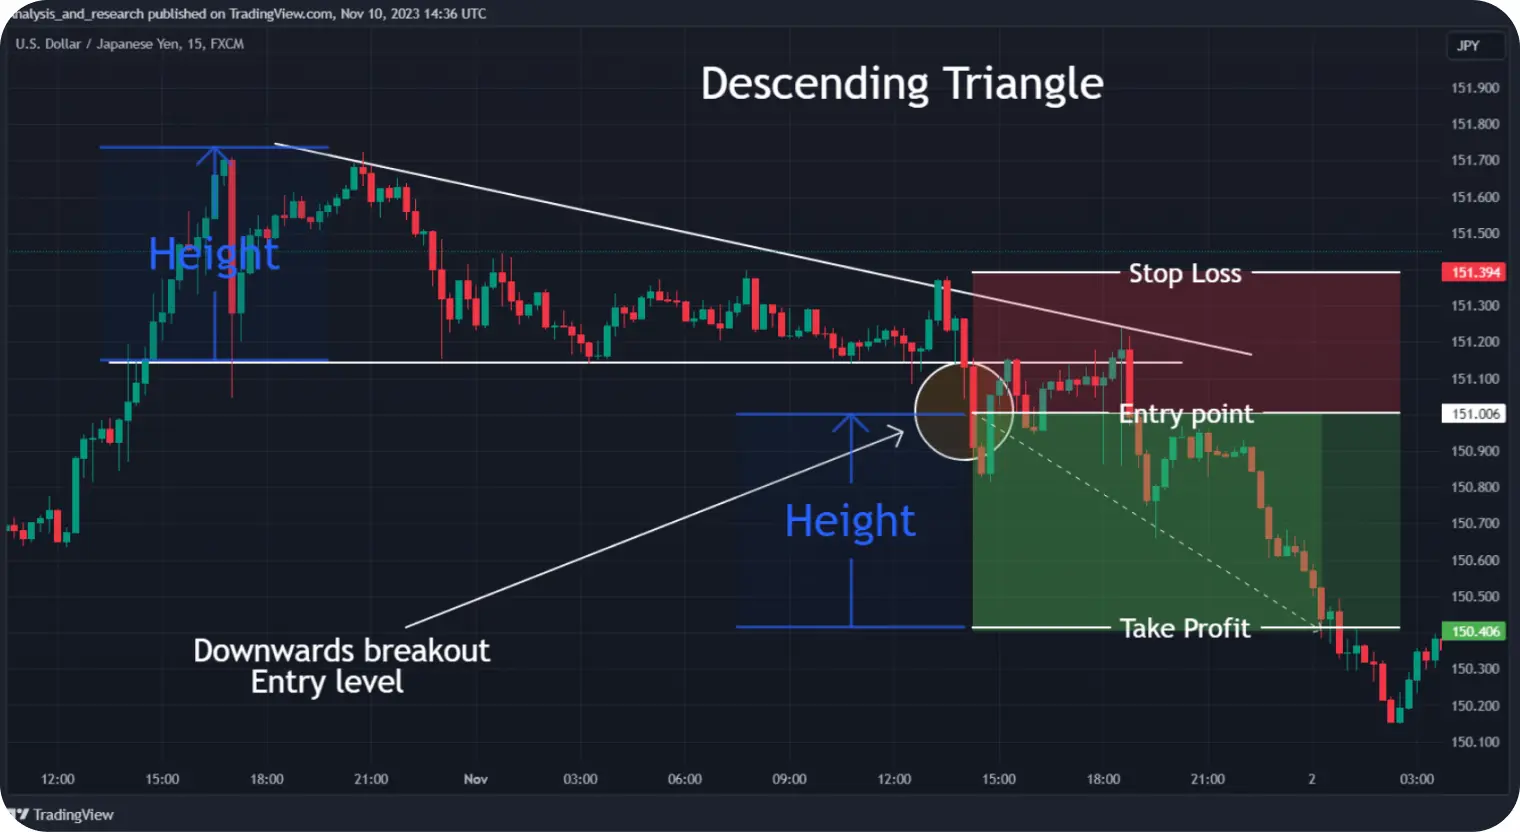
A valid descending triangle probably indicates a downward trend, so prepare to sell the asset.
1.After the pattern forms, wait for a breakout indicating the bearish trend.
2.If the price breaks out upwards, place a Buy order with a Stop Loss below the last minimum.
3.If the price breaks out downwards (as expected), place a Sell order with a Stop Loss above the last maximum—or wait for additional confirmation.
4.Set your Take Profit below the triangle at the level equal to its height. `
A valid symmetrical triangle can break out in any direction, so be careful.
1.After the breakout, enter the trade immediately or wait for additional confirmation, such as a retest.
2.If the price breaks out upwards, place a Buy order with a Stop Loss below the last minimum. Set your Take Profit target above the triangle at the level equal to its height.
3.If the price breaks out downwards, place a Sell order with a Stop Loss above the last maximum. Set your Take Profit target below the triangle at the level equal to its height.
