Double top and bottom patterns are frequent chart patterns that can easily be recognised—and used for trading—even by a beginner. This article will teach you how to spot a double top or a double bottom and which trading strategy to apply for each.

Get fresh market news, expert insights, and bite-sized educational materials in Space, your personalised feed available for free on all PeMaxxTrader accounts. Apply the insights to trade in one touch with necessary technical analysis tools included.
Try PeMaxxTraderA double top pattern forms at the peak of an upward (bullish) trend. It looks like two consecutive peaks on the price chart, resembling the letter M. That is why it’s sometimes called the M pattern on the market.
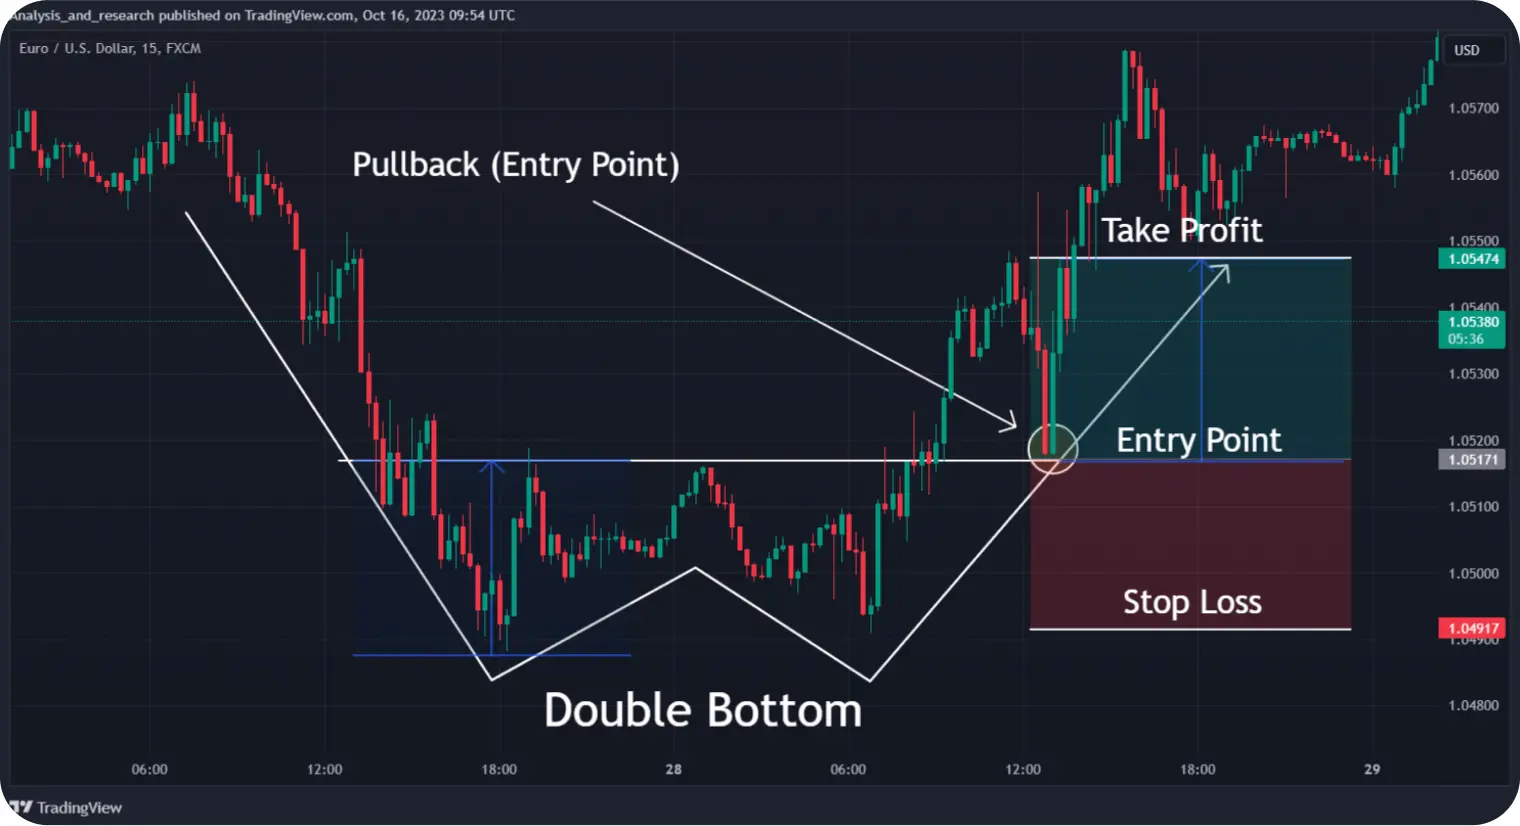
A double bottom is the opposite pattern. It forms at the end of a downward (bearish) trend in two more or less equal-sized troughs. They look like the letter W, hence another name for it: the W pattern.
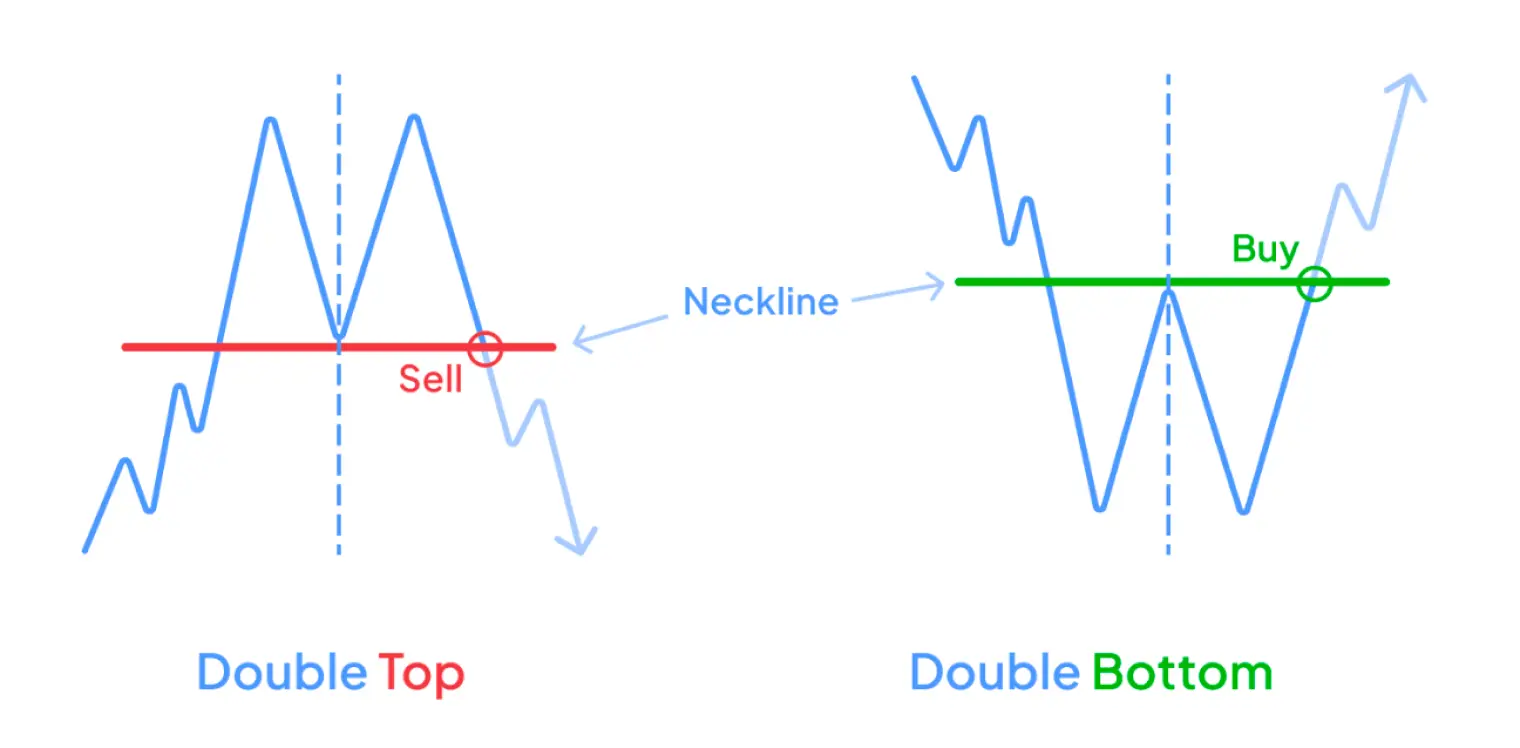
Both patterns have a middle line called the neckline. For a double top, it is drawn through the lowest point between the peaks. For a double bottom, it runs through the highest point between the troughs.
Double tops and double bottoms indicate a possible trend reversal. If you see a double top at some point of an upward trend, there’s a good chance that the price will start going down afterwards. If you encounter a double bottom on an extended downward trend, the price might start moving up shortly after.
However, not every double shoulder pattern on the chart is a strong signal for a trend reversal. To prevent costly mistakes, you must learn to identify double top and double bottom patterns correctly.
Search for a double top at the peak of an upward (bullish) trend. When an upside-down U pattern forms, it may be the first sign of an M pattern. If another top appears, use the neckline to confirm the trianglepattern Once the price breaks out from this level, it will probably continue going down, completing the pattern.
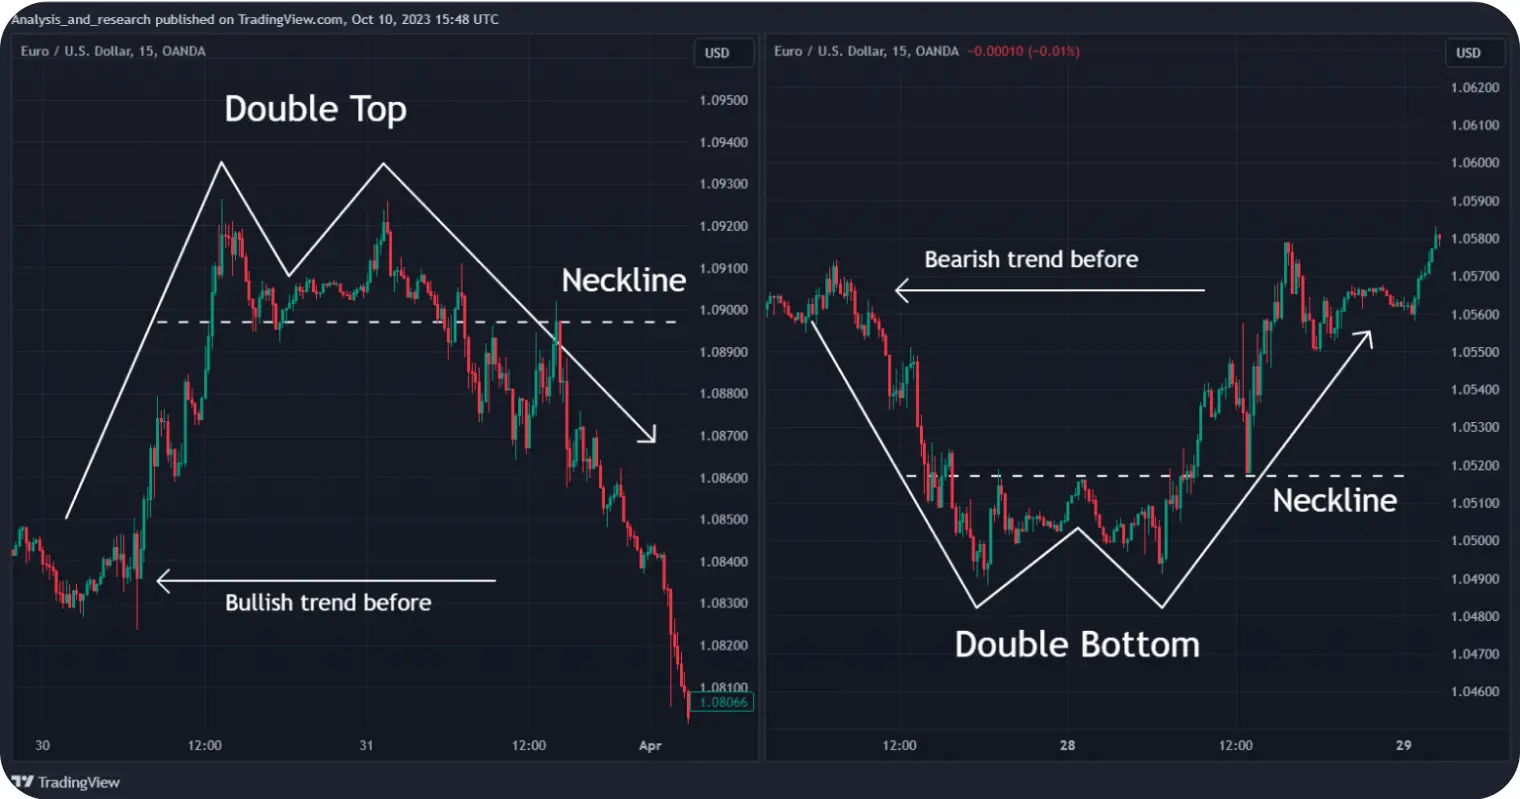
To Double bottoms occur at the lowest points of downward (bearish) trends. When you see a U pattern, wait for another trough to form. You can use the neckline to confirm the trend reversal. If the price rises above this level, it will probably continue growing, completing the pattern and generating a trade signal.

When looking for a double top or a double bottom, you should remember that the peaks and troughs may not necessarily be of the exact same size. Always consider the context and look for ways to confirm even the most obvious M or W patterns.
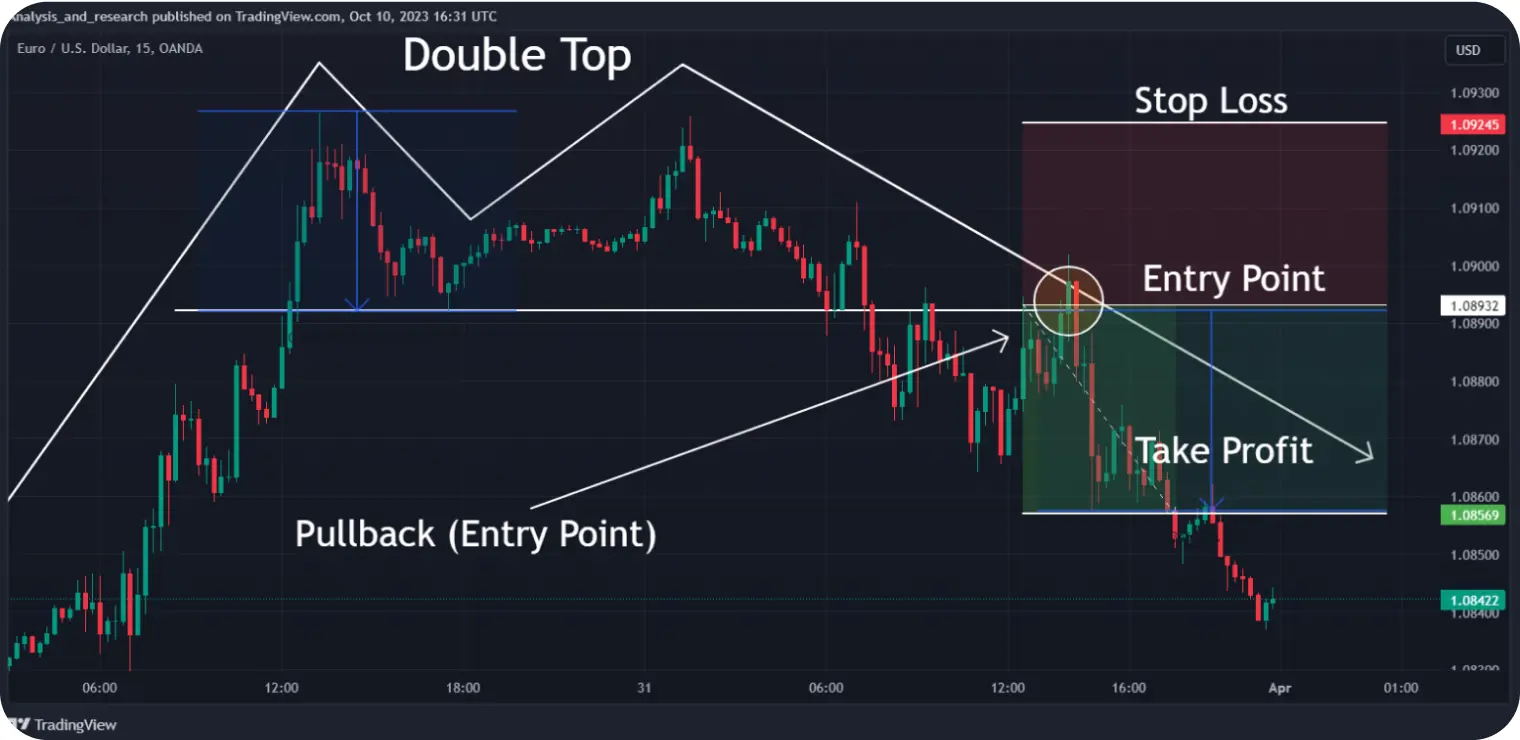
A correctly identified double top is a sign of an upcoming bearish trend, so you should sell the asset.
1.AWait for the M pattern breakout past the neckline to confirm the Sell signal.
2.Set a Sell order near the neckline level and wait for the next pullback: the price will briefly return to that level in most cases, providing you with an entry point.
3.Set your Stop Loss slightly above the price level of the second peak.
4.Set your Take Profit at the same distance from the neckline as it is from the first peak.
A double bottom pattern means that you should expect a bullish trend and prepare to buy the asset.
1.Wait for the price to break out above the neckline: it is a possible Buy signal.
2.Set a Buy order near the neckline level and wait for the price to touch it once again.
3.Set your Stop Loss below the price level of the second trough.
4.Set your Take Profit at least at the same distance from the neckline as it is from the first trough to establish your profit target for the order.
