A wedge is a typical chart pattern defined by two converging trend lines. This article will teach you about finding bullish and bearish wedges and choosing a trading strategies to apply.


Get fresh market news, expert insights, and bite-sized educational materials in Space, your personalised feed available for free on all PeMaxxTrader accounts. Apply the insights to trade in one touch with necessary technical analysis tools included.
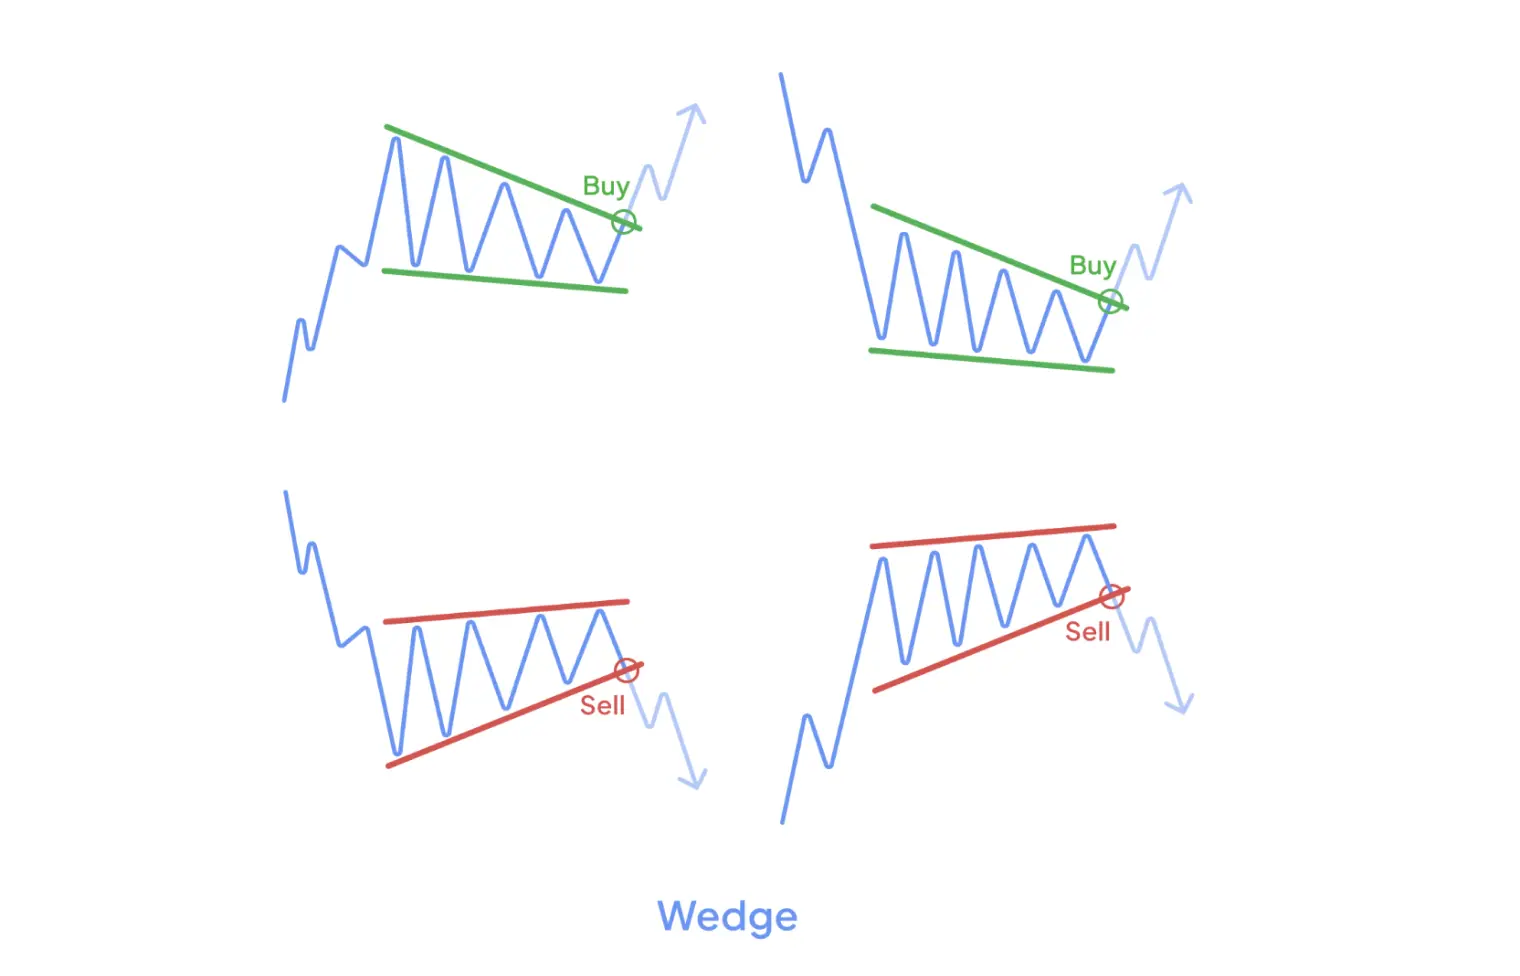
Try PeMaxxTraderThe wedge pattern forms between two converging trend lines along a narrowing price range. Wedges can occur on both upward and downward trends. The pattern's body direction is what defines the outcome Click here.

A wedge with a rising body (pointing up) is a bearish pattern: the price will probably decrease. A wedge with a falling body (pointing down) is a bullish pattern: the price will likely increase after the breakout.

Wedges may look similar to flags and triangle patterns, but they are all different. Unlike flags, wedges do not require a strong preceding trend (the so-called flagpole) to be valid. Unlike triangles, wedge patterns usually have no horizontal trend lines—both are diagonal and lean in the same direction.
A wedge can occur for any trading strategies instrument on any timeframe. It is known as a reversal pattern, but that applies to the direction of the wedge itself and not to the previous trend.
However, the strongest wedge patterns that provide reliable trading signals generally form after powerful trends on the longest timeframes: several weeks or even months.

A valid wedge usually lasts 10 to 50 candlesticks. Look for a consolidation in the characteristic shape and wait for a breakout. You can also check out whether the trading volume is declining to confirm the pattern.
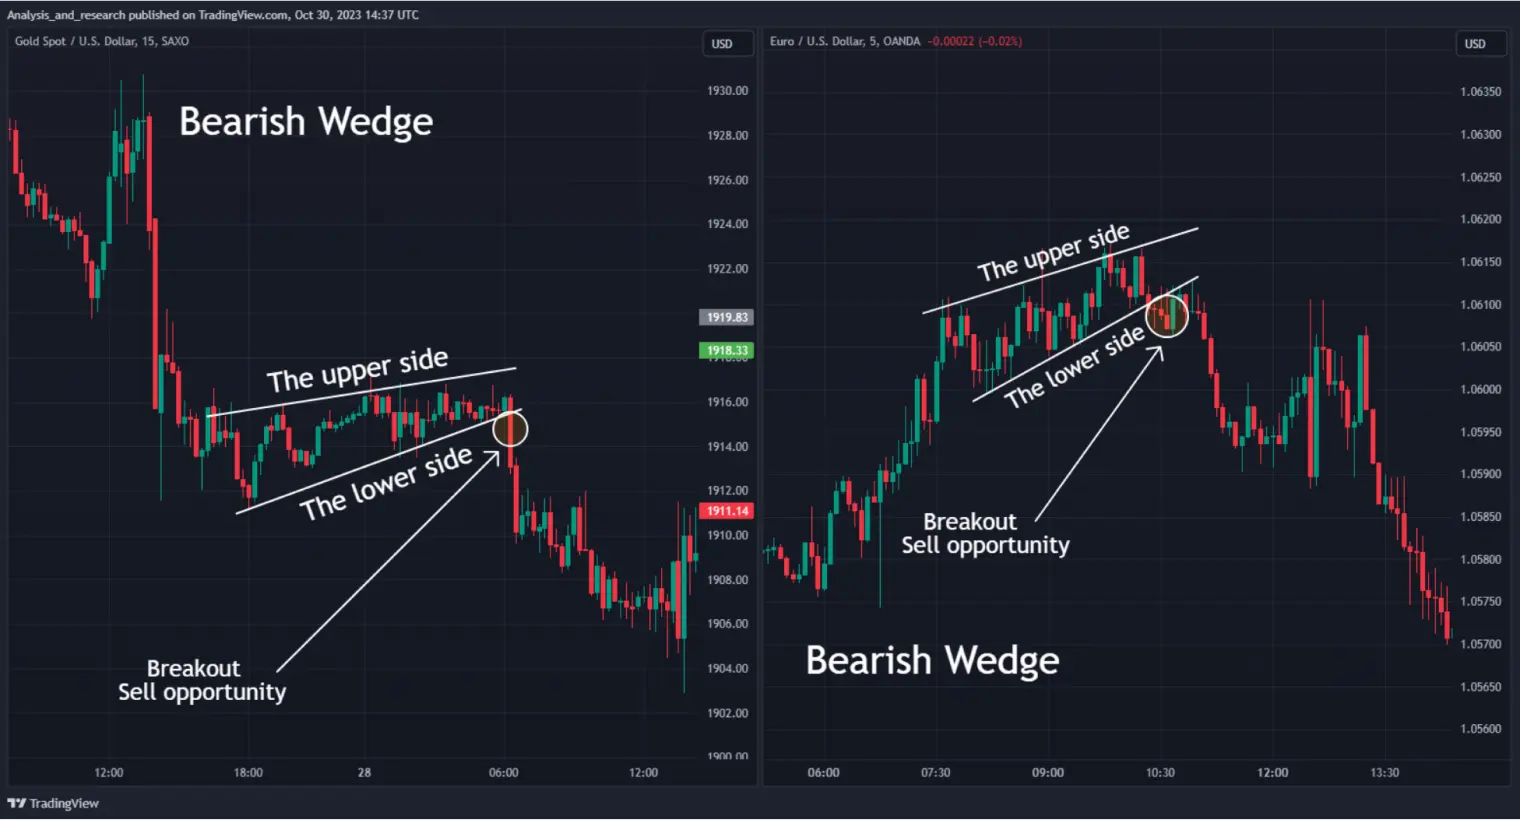
A rising wedge occurs within a narrowing price range with both trend lines pointing up.
After the breakout, the price collapses regardless of the previous trend direction, starting
a downward trend.

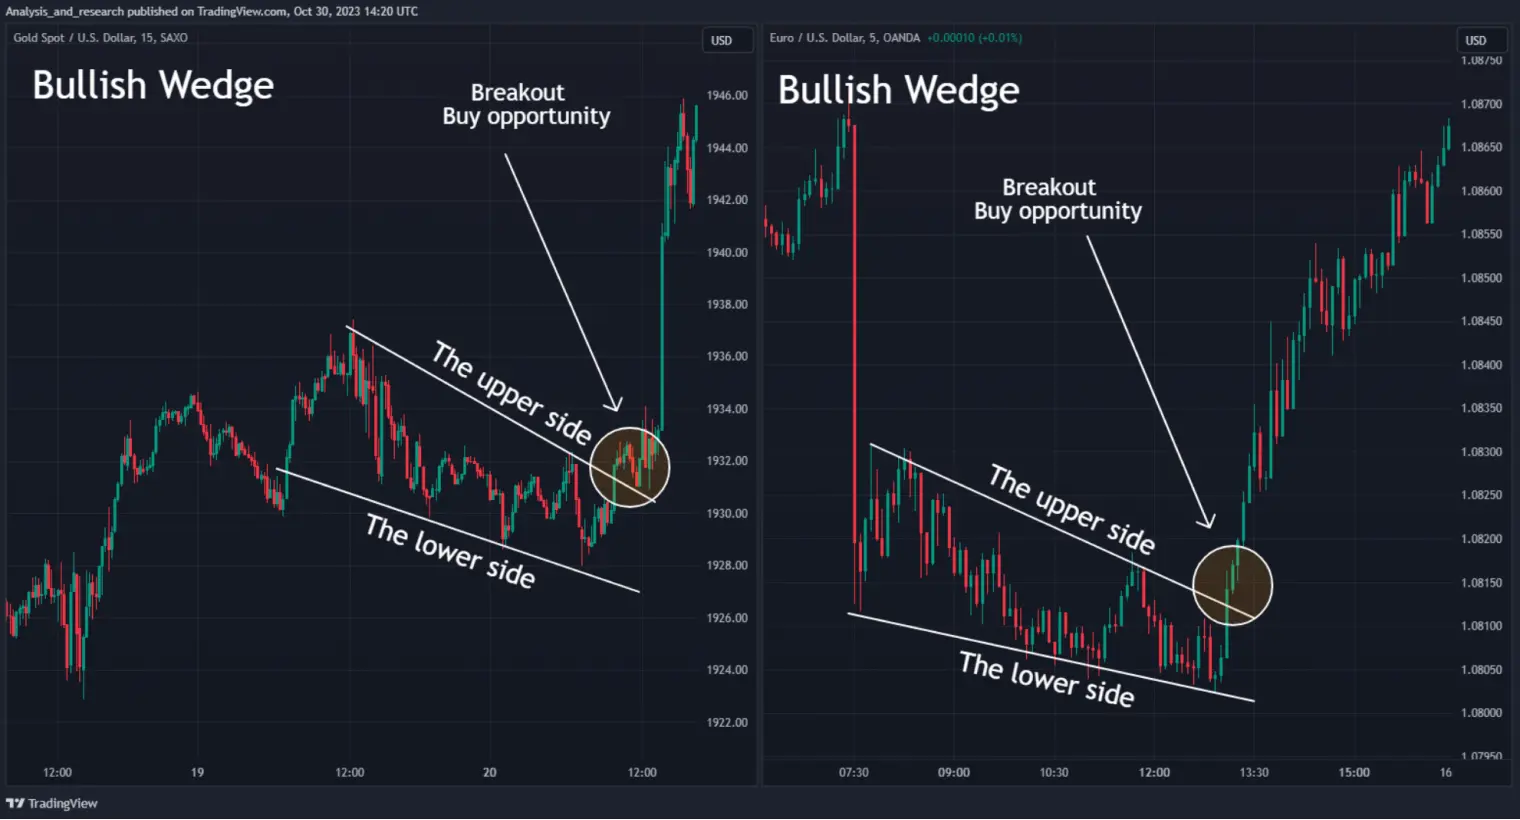
A falling wedge forms as a converging price range with both trend lines pointing down. After the breakout, the price rushes up regardless of the previous trend direction, starting an upward trend.

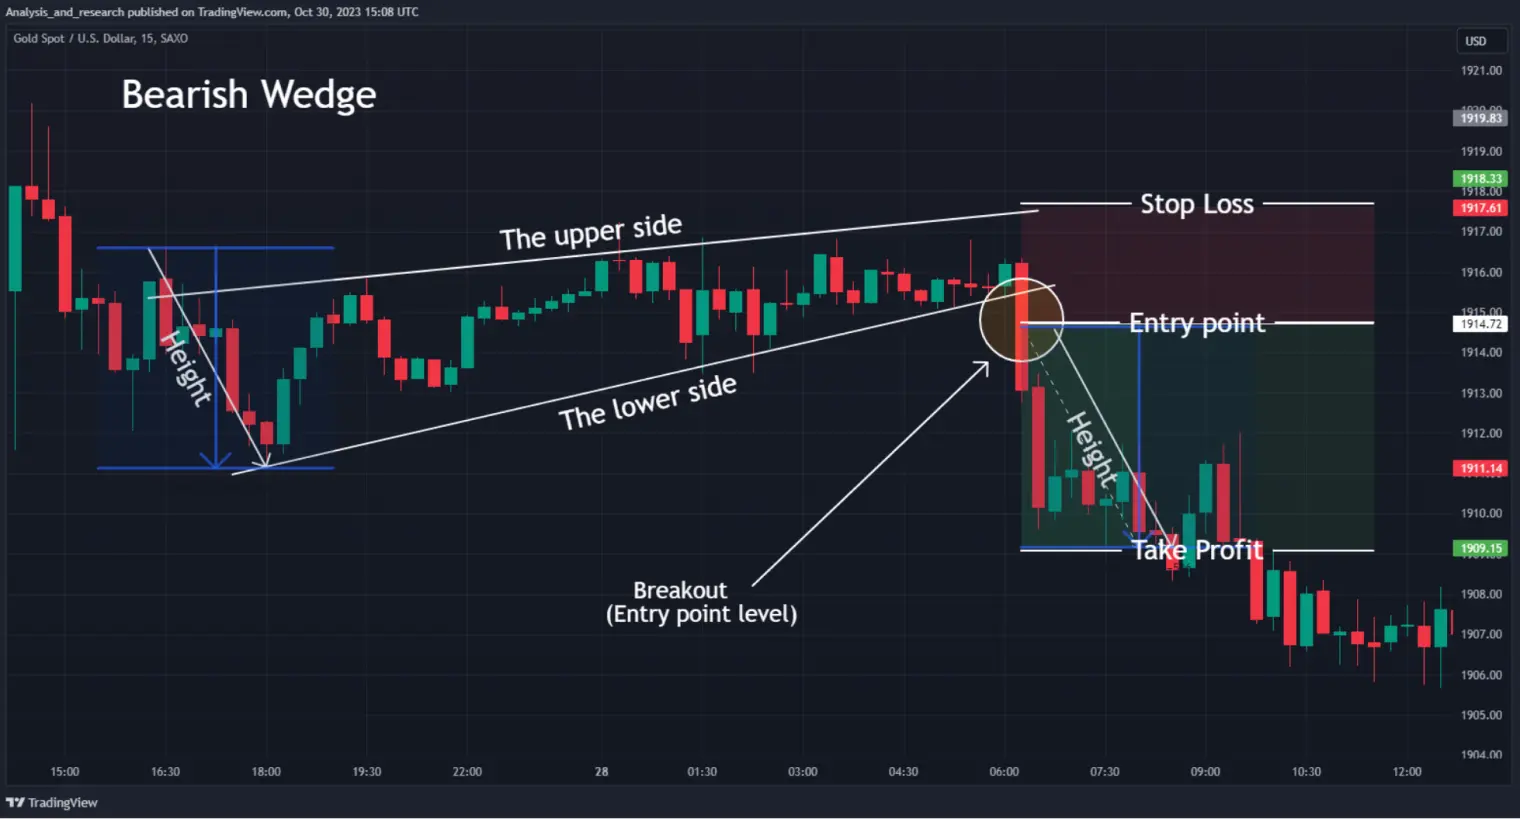
The ascending wedge pattern signifies that the price will probably decrease, so you should sell the asset.
1.Once the pattern is formed, look for a breakout of the lower side.
2.Enter immediately or wait for a confirmation, like a retest from below.
3.Open a Sell order and set your Stop Loss above the last maximum.
4.Set your Take Profit target at the level equal to the pattern's max height.

The descending wedge pattern signifies that the price will likely increase, so you should buy the asset.
1.Once the pattern is formed, look for a breakout of the upper side.
2.Enter immediately or wait for a confirmation, like a retest from above.
3.Open a Buy order and set your stop loss below the last minimum.
4.Set your take-profit target at the level equal to the pattern's max height.
